Quick Links
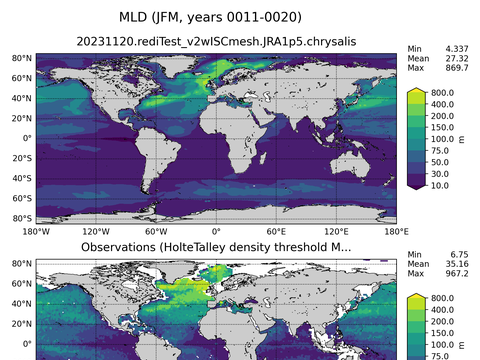
Global Mixed-Layer Depth

Global Sea Surface Temperature

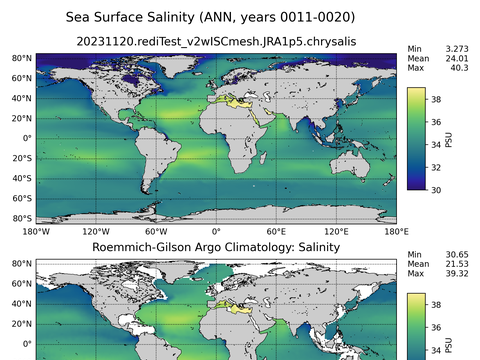
Global Sea Surface Salinity

Global Sea Surface Height

Global Horizontal Streamfunction

Arctic Extended Horizontal Streamfunction

Antarctic Extended Horizontal Streamfunction

Subpolar North Atlantic Horizontal Streamfunction

Global OHC Anomaly
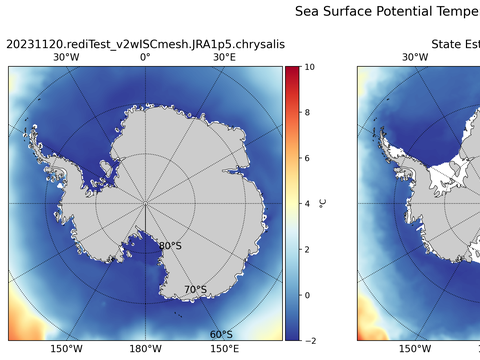
Antarctic Potential Temperature

Antarctic Salinity
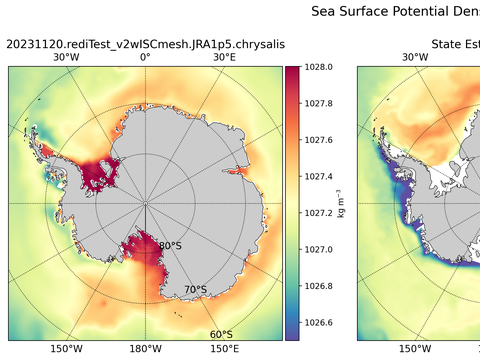
Antarctic Potential Density
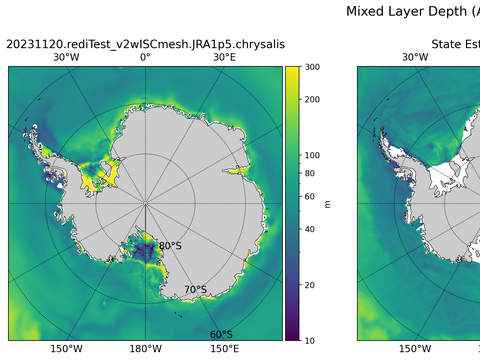
Antarctic Mixed Layer Depth

Antarctic Zonal Velocity

Antarctic Meridional Velocity

Antarctic Velocity Magnitude

Arctic Potential Temperature

Arctic Salinity

Global Argo Potential Temperature
Global Argo Salinity

Antarctic Seafloor Maps

T-S Diagrams

Arctic Ocean Regions Time Series

Antarctic Regions Time Series
Trends vs Depth

Time Series

Transport Time Series

Meridional Heat Transport

Meridional Overturning Streamfunction

WOCE Transects

SOSE Transects

Arctic Ocean Regional Profiles

Antarctic Regional Profiles

Arctic Ocean Regions Time Series vs Depths

Antarctic Regions Time Series vs Depths
Observations: Holte-Talley ARGO

JFM

JAS

ANN
Observations: Hadley-NOAA-OI

JFM

JAS

ANN
Observations: Aquarius

JFM

JAS

ANN
Observations: AVISO

JFM

JAS

ANN

ANN

ANN

ANN

ANN

ANN

ANN

ANN

ANN

ANN

ANN

ANN

ANN
State Estimate: SOSE

ANN surface

JFM surface

JAS surface

ANN z=-200 m

JFM z=-200 m

JAS z=-200 m

ANN z=-400 m

JFM z=-400 m

JAS z=-400 m

ANN z=-600 m

JFM z=-600 m

JAS z=-600 m

ANN z=-800 m

JFM z=-800 m

JAS z=-800 m

ANN floor

JFM floor

JAS floor
WOA18 Climatology

ANN surface

JFM surface

JAS surface

ANN z=-50 m

JFM z=-50 m

JAS z=-50 m

ANN z=-200 m

JFM z=-200 m

JAS z=-200 m

ANN z=-400 m

JFM z=-400 m

JAS z=-400 m

ANN z=-600 m

JFM z=-600 m

JAS z=-600 m

ANN z=-800 m

JFM z=-800 m

JAS z=-800 m
State Estimate: SOSE

ANN surface

JFM surface

JAS surface

ANN z=-200 m

JFM z=-200 m

JAS z=-200 m

ANN z=-400 m

JFM z=-400 m

JAS z=-400 m

ANN z=-600 m

JFM z=-600 m

JAS z=-600 m

ANN z=-800 m

JFM z=-800 m

JAS z=-800 m

ANN floor

JFM floor

JAS floor
State Estimate: SOSE

ANN

JFM

JAS
State Estimate: SOSE

ANN surface

JFM surface

JAS surface

ANN z=-200 m

JFM z=-200 m

JAS z=-200 m

ANN z=-400 m

JFM z=-400 m

JAS z=-400 m

ANN z=-600 m

JFM z=-600 m

JAS z=-600 m

ANN z=-800 m

JFM z=-800 m

JAS z=-800 m

ANN floor

JFM floor

JAS floor
State Estimate: SOSE

ANN surface

JFM surface

JAS surface

ANN z=-200 m

JFM z=-200 m

JAS z=-200 m

ANN z=-400 m

JFM z=-400 m

JAS z=-400 m

ANN z=-600 m

JFM z=-600 m

JAS z=-600 m

ANN z=-800 m

JFM z=-800 m

JAS z=-800 m

ANN floor

JFM floor

JAS floor
State Estimate: SOSE

ANN surface

JFM surface

JAS surface

ANN z=-200 m

JFM z=-200 m

JAS z=-200 m

ANN z=-400 m

JFM z=-400 m

JAS z=-400 m

ANN z=-600 m

JFM z=-600 m

JAS z=-600 m

ANN z=-800 m

JFM z=-800 m

JAS z=-800 m

ANN floor

JFM floor

JAS floor
WOA18 Climatology

ANN surface

JFM surface

JAS surface

ANN z=-50 m

JFM z=-50 m

JAS z=-50 m

ANN z=-200 m

JFM z=-200 m

JAS z=-200 m

ANN z=-400 m

JFM z=-400 m

JAS z=-400 m

ANN z=-600 m

JFM z=-600 m

JAS z=-600 m

ANN z=-800 m

JFM z=-800 m

JAS z=-800 m
WOA18 Climatology

ANN surface

JFM surface

JAS surface

ANN z=-50 m

JFM z=-50 m

JAS z=-50 m

ANN z=-200 m

JFM z=-200 m

JAS z=-200 m

ANN z=-400 m

JFM z=-400 m

JAS z=-400 m

ANN z=-600 m

JFM z=-600 m

JAS z=-600 m

ANN z=-800 m

JFM z=-800 m

JAS z=-800 m
Roemmich-Gilson Climatology: Argo

ANN surface

ANN z=-25 m

ANN z=-50 m

ANN z=-100 m

ANN z=-150 m

ANN z=-200 m

ANN z=-400 m

ANN z=-800 m

ANN z=-1500 m

JAS surface

JAS z=-25 m

JAS z=-50 m

JAS z=-100 m

JAS z=-150 m

JAS z=-200 m

JAS z=-400 m

JAS z=-800 m

JAS z=-1500 m

JFM surface

JFM z=-25 m

JFM z=-50 m

JFM z=-100 m

JFM z=-150 m

JFM z=-200 m

JFM z=-400 m

JFM z=-800 m

JFM z=-1500 m
Roemmich-Gilson Climatology: Argo

ANN surface

ANN z=-25 m

ANN z=-50 m

ANN z=-100 m

ANN z=-150 m

ANN z=-200 m

ANN z=-400 m

ANN z=-600 m

ANN z=-800 m

ANN z=-1500 m

JFM surface

JFM z=-25 m

JFM z=-50 m

JFM z=-100 m

JFM z=-150 m

JFM z=-200 m

JFM z=-400 m

JFM z=-600 m

JFM z=-800 m

JFM z=-1500 m

JAS surface

JAS z=-25 m

JAS z=-50 m

JAS z=-100 m

JAS z=-150 m

JAS z=-200 m

JAS z=-400 m

JAS z=-600 m

JAS z=-800 m

JAS z=-1500 m
Potential Temperature

ANN floor

JFM floor

JAS floor
Salinity

ANN floor

JFM floor

JAS floor
Potential Density

ANN floor

JFM floor

JAS floor
Antarctic Regions

Southern Ocean

Southern Ocean 60S

Eastern Weddell Sea Shelf

Eastern Weddell Sea Deep

Western Weddell Sea Shelf

Western Weddell Sea Deep

Weddell Sea Shelf

Weddell Sea Deep

Bellingshausen Sea Shelf

Bellingshausen Sea Deep

Amundsen Sea Shelf

Amundsen Sea Deep

Eastern Ross Sea Shelf

Eastern Ross Sea Deep

Western Ross Sea Shelf

Western Ross Sea Deep

East Antarctic Seas Shelf

East Antarctic Seas Deep
Arctic Ocean Regions

Baffin Bay

Barents Sea

Canada Basin

Greenland Sea

Irminger Sea

Kara Sea

Labrador Sea

Norwegian Sea

Arctic Ocean - no Barents, Kara Seas
Ocean Basins

Atlantic_Basin

Pacific_Basin

Indian_Basin

Arctic_Basin

Southern_Ocean_Basin

Global Ocean

Global Ocean 65N to 65S
Temperature

Baffin Bay

Baltic Sea

Barents Sea

Beaufort Gyre

Beaufort Gyre Shelf

Canada Basin

Canadian Archipelago

Central Arctic

Chukchi Sea

East Siberian Sea

Greenland Sea

Hudson Bay

Irminger Sea

Kara Sea

Labrador Sea

Laptev Sea

North Sea

Norwegian Sea

Arctic Ocean - no Barents, Kara Seas
Salinity

Baffin Bay

Baltic Sea

Barents Sea

Beaufort Gyre

Beaufort Gyre Shelf

Canada Basin

Canadian Archipelago

Central Arctic

Chukchi Sea

East Siberian Sea

Greenland Sea

Hudson Bay

Irminger Sea

Kara Sea

Labrador Sea

Laptev Sea

North Sea

Norwegian Sea

Arctic Ocean - no Barents, Kara Seas
Potential Density

Baffin Bay

Baltic Sea

Barents Sea

Beaufort Gyre

Beaufort Gyre Shelf

Canada Basin

Canadian Archipelago

Central Arctic

Chukchi Sea

East Siberian Sea

Greenland Sea

Hudson Bay

Irminger Sea

Kara Sea

Labrador Sea

Laptev Sea

North Sea

Norwegian Sea

Arctic Ocean - no Barents, Kara Seas
Mixed Layer Depth

Baffin Bay

Baltic Sea

Barents Sea

Beaufort Gyre

Beaufort Gyre Shelf

Canada Basin

Canadian Archipelago

Central Arctic

Chukchi Sea

East Siberian Sea

Greenland Sea

Hudson Bay

Irminger Sea

Kara Sea

Labrador Sea

Laptev Sea

North Sea

Norwegian Sea

Arctic Ocean - no Barents, Kara Seas
Temperature

Southern Ocean

Southern Ocean 60S

Eastern Weddell Sea Shelf

Eastern Weddell Sea Deep

Western Weddell Sea Shelf

Western Weddell Sea Deep

Weddell Sea Shelf

Weddell Sea Deep

Bellingshausen Sea Shelf

Bellingshausen Sea Deep

Amundsen Sea Shelf

Amundsen Sea Deep

Eastern Ross Sea Shelf

Eastern Ross Sea Deep

Western Ross Sea Shelf

Western Ross Sea Deep

East Antarctic Seas Shelf

East Antarctic Seas Deep
Salinity

Southern Ocean

Southern Ocean 60S

Eastern Weddell Sea Shelf

Eastern Weddell Sea Deep

Western Weddell Sea Shelf

Western Weddell Sea Deep

Weddell Sea Shelf

Weddell Sea Deep

Bellingshausen Sea Shelf

Bellingshausen Sea Deep

Amundsen Sea Shelf

Amundsen Sea Deep

Eastern Ross Sea Shelf

Eastern Ross Sea Deep

Western Ross Sea Shelf

Western Ross Sea Deep

East Antarctic Seas Shelf

East Antarctic Seas Deep
Potential Density

Southern Ocean

Southern Ocean 60S

Eastern Weddell Sea Shelf

Eastern Weddell Sea Deep

Western Weddell Sea Shelf

Western Weddell Sea Deep

Weddell Sea Shelf

Weddell Sea Deep

Bellingshausen Sea Shelf

Bellingshausen Sea Deep

Amundsen Sea Shelf

Amundsen Sea Deep

Eastern Ross Sea Shelf

Eastern Ross Sea Deep

Western Ross Sea Shelf

Western Ross Sea Deep

East Antarctic Seas Shelf

East Antarctic Seas Deep
Thermal Forcing

Southern Ocean

Southern Ocean 60S

Eastern Weddell Sea Shelf

Eastern Weddell Sea Deep

Western Weddell Sea Shelf

Western Weddell Sea Deep

Weddell Sea Shelf

Weddell Sea Deep

Bellingshausen Sea Shelf

Bellingshausen Sea Deep

Amundsen Sea Shelf

Amundsen Sea Deep

Eastern Ross Sea Shelf

Eastern Ross Sea Deep

Western Ross Sea Shelf

Western Ross Sea Deep

East Antarctic Seas Shelf

East Antarctic Seas Deep
Mixed Layer Depth

Southern Ocean

Southern Ocean 60S

Eastern Weddell Sea Shelf

Eastern Weddell Sea Deep

Western Weddell Sea Shelf

Western Weddell Sea Deep

Weddell Sea Shelf

Weddell Sea Deep

Bellingshausen Sea Shelf

Bellingshausen Sea Deep

Amundsen Sea Shelf

Amundsen Sea Deep

Eastern Ross Sea Shelf

Eastern Ross Sea Deep

Western Ross Sea Shelf

Western Ross Sea Deep

East Antarctic Seas Shelf

East Antarctic Seas Deep

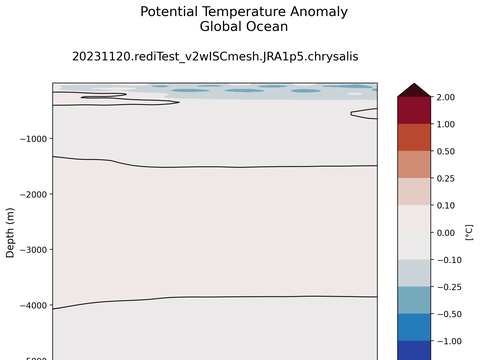
Global Ocean Δϴ

Global Ocean ΔS

Global Ocean ΔOHC

global ΔOHC

SSH Anomaly

global SST

Drake Passage

Tasmania-Ant

Africa-Ant

Antilles Inflow

Mona Passage

Windward Passage

Florida-Cuba

Florida-Bahamas

Indonesian Throughflow

Agulhas

Mozambique Channel

Bering Strait

Lancaster Sound

Fram Strait

Nares Strait

Denmark Strait

Iceland-Faroe-Scotland


Global

Atlantic

AtlanticMed

IndoPacific

Time Series
Potential Temperature

ANN

ANN

ANN

ANN

ANN

ANN
Salinity

ANN

ANN

ANN

ANN

ANN

ANN
Potential Density

ANN

ANN

ANN

ANN

ANN

ANN
Potential Density Contours

ANN

ANN

ANN

ANN

ANN

ANN
Potential Temperature

ANN

JFM

JAS

ANN

JFM

JAS

ANN

JFM

JAS

ANN

JFM

JAS

ANN

JFM

JAS

ANN

JFM

JAS

ANN

JFM

JAS

ANN

JFM

JAS

ANN

JFM

JAS

ANN

JFM

JAS

ANN

JFM

JAS

ANN

JFM

JAS

ANN

JFM

JAS
Salinity

ANN

JFM

JAS

ANN

JFM

JAS

ANN

JFM

JAS

ANN

JFM

JAS

ANN

JFM

JAS

ANN

JFM

JAS

ANN

JFM

JAS

ANN

JFM

JAS

ANN

JFM

JAS

ANN

JFM

JAS

ANN

JFM

JAS

ANN

JFM

JAS

ANN

JFM

JAS
Potential Density

ANN

JFM

JAS

ANN

JFM

JAS

ANN

JFM

JAS

ANN

JFM

JAS

ANN

JFM

JAS

ANN

JFM

JAS

ANN

JFM

JAS

ANN

JFM

JAS

ANN

JFM

JAS

ANN

JFM

JAS

ANN

JFM

JAS

ANN

JFM

JAS

ANN

JFM

JAS
Zonal Velocity

ANN

JFM

JAS

ANN

JFM

JAS

ANN

JFM

JAS

ANN

JFM

JAS

ANN

JFM

JAS

ANN

JFM

JAS

ANN

JFM

JAS

ANN

JFM

JAS

ANN

JFM

JAS

ANN

JFM

JAS

ANN

JFM

JAS

ANN

JFM

JAS

ANN

JFM

JAS
Meridional Velocity

ANN

JFM

JAS

ANN

JFM

JAS

ANN

JFM

JAS

ANN

JFM

JAS

ANN

JFM

JAS

ANN

JFM

JAS

ANN

JFM

JAS

ANN

JFM

JAS

ANN

JFM

JAS

ANN

JFM

JAS

ANN

JFM

JAS

ANN

JFM

JAS

ANN

JFM

JAS
Velocity Magnitude

ANN

JFM

JAS

ANN

JFM

JAS

ANN

JFM

JAS

ANN

JFM

JAS

ANN

JFM

JAS

ANN

JFM

JAS

ANN

JFM

JAS

ANN

JFM

JAS

ANN

JFM

JAS

ANN

JFM

JAS

ANN

JFM

JAS

ANN

JFM

JAS

ANN

JFM

JAS
Potential Density Contours

ANN

JFM

JAS

ANN

JFM

JAS

ANN

JFM

JAS

ANN

JFM

JAS

ANN

JFM

JAS

ANN

JFM

JAS

ANN

JFM

JAS

ANN

JFM

JAS

ANN

JFM

JAS

ANN

JFM

JAS

ANN

JFM

JAS

ANN

JFM

JAS

ANN

JFM

JAS
Potential Temperature

Baffin Bay ANN

Barents Sea ANN

Canada Basin ANN

Greenland Sea ANN

Irminger Sea ANN

Kara Sea ANN

Labrador Sea ANN

Norwegian Sea ANN

Arctic Ocean - no Barents, Kara Seas ANN
Salinity

Baffin Bay ANN

Barents Sea ANN

Canada Basin ANN

Greenland Sea ANN

Irminger Sea ANN

Kara Sea ANN

Labrador Sea ANN

Norwegian Sea ANN

Arctic Ocean - no Barents, Kara Seas ANN
Potential Density

Baffin Bay ANN

Barents Sea ANN

Canada Basin ANN

Greenland Sea ANN

Irminger Sea ANN

Kara Sea ANN

Labrador Sea ANN

Norwegian Sea ANN

Arctic Ocean - no Barents, Kara Seas ANN
Potential Temperature

Southern Ocean 60S ANN

Weddell Sea Shelf ANN

Weddell Sea Deep ANN

Bellingshausen Sea Shelf ANN

Bellingshausen Sea Deep ANN

Amundsen Sea Shelf ANN

Amundsen Sea Deep ANN

Eastern Ross Sea Shelf ANN

Eastern Ross Sea Deep ANN

Western Ross Sea Shelf ANN

Western Ross Sea Deep ANN

East Antarctic Seas Shelf ANN

East Antarctic Seas Deep ANN
Salinity

Southern Ocean 60S ANN

Weddell Sea Shelf ANN

Weddell Sea Deep ANN

Bellingshausen Sea Shelf ANN

Bellingshausen Sea Deep ANN

Amundsen Sea Shelf ANN

Amundsen Sea Deep ANN

Eastern Ross Sea Shelf ANN

Eastern Ross Sea Deep ANN

Western Ross Sea Shelf ANN

Western Ross Sea Deep ANN

East Antarctic Seas Shelf ANN

East Antarctic Seas Deep ANN
Potential Density

Southern Ocean 60S ANN

Weddell Sea Shelf ANN

Weddell Sea Deep ANN

Bellingshausen Sea Shelf ANN

Bellingshausen Sea Deep ANN

Amundsen Sea Shelf ANN

Amundsen Sea Deep ANN

Eastern Ross Sea Shelf ANN

Eastern Ross Sea Deep ANN

Western Ross Sea Shelf ANN

Western Ross Sea Deep ANN

East Antarctic Seas Shelf ANN

East Antarctic Seas Deep ANN
Potential Temperature

Baffin Bay

Barents Sea

Canada Basin

Greenland Sea

Irminger Sea

Kara Sea

Labrador Sea

Norwegian Sea

Arctic Ocean - no Barents, Kara Seas
Salinity

Baffin Bay

Barents Sea

Canada Basin

Greenland Sea

Irminger Sea

Kara Sea

Labrador Sea

Norwegian Sea

Arctic Ocean - no Barents, Kara Seas
Potential Density

Baffin Bay

Barents Sea

Canada Basin

Greenland Sea

Irminger Sea

Kara Sea

Labrador Sea

Norwegian Sea

Arctic Ocean - no Barents, Kara Seas
Potential Temperature

Southern Ocean 60S

Weddell Sea Shelf

Weddell Sea Deep

Bellingshausen Sea Shelf

Bellingshausen Sea Deep

Amundsen Sea Shelf

Amundsen Sea Deep

Eastern Ross Sea Shelf

Eastern Ross Sea Deep

Western Ross Sea Shelf

Western Ross Sea Deep

East Antarctic Seas Shelf

East Antarctic Seas Deep
Salinity

Southern Ocean 60S

Weddell Sea Shelf

Weddell Sea Deep

Bellingshausen Sea Shelf

Bellingshausen Sea Deep

Amundsen Sea Shelf

Amundsen Sea Deep

Eastern Ross Sea Shelf

Eastern Ross Sea Deep

Western Ross Sea Shelf

Western Ross Sea Deep

East Antarctic Seas Shelf

East Antarctic Seas Deep
Potential Density

Southern Ocean 60S

Weddell Sea Shelf

Weddell Sea Deep

Bellingshausen Sea Shelf

Bellingshausen Sea Deep

Amundsen Sea Shelf

Amundsen Sea Deep

Eastern Ross Sea Shelf

Eastern Ross Sea Deep

Western Ross Sea Shelf

Western Ross Sea Deep

East Antarctic Seas Shelf

East Antarctic Seas Deep