Quick Links
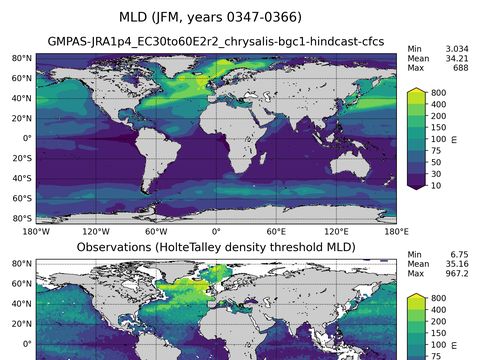
Global Mixed-Layer Depth
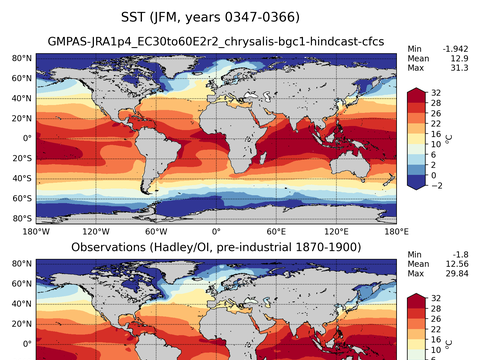
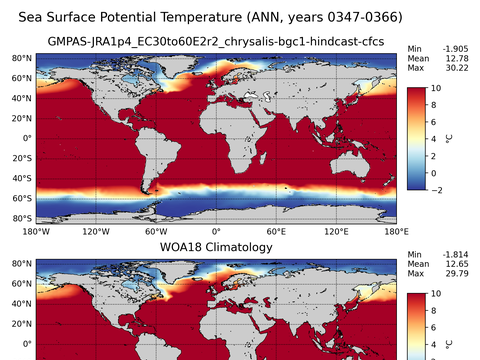
Global Sea Surface Temperature
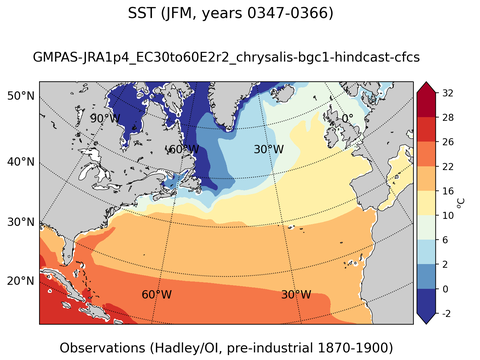
North atlantic Sea Surface Temperature
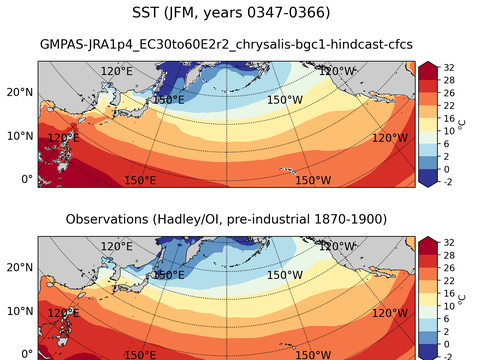
North pacific Sea Surface Temperature
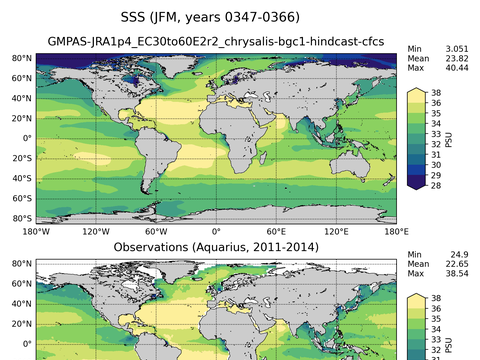
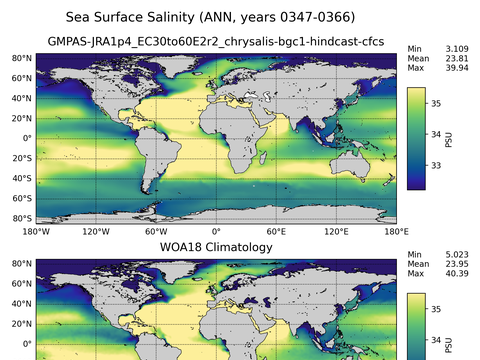
Global Sea Surface Salinity
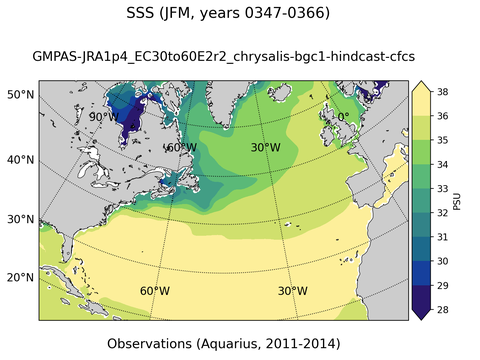
North atlantic Sea Surface Salinity
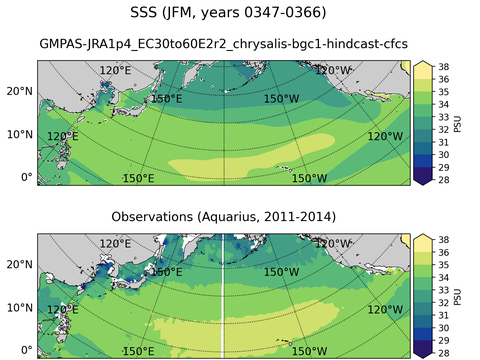
North pacific Sea Surface Salinity
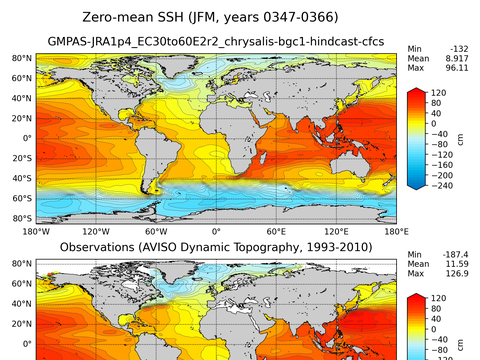
Global Sea Surface Height
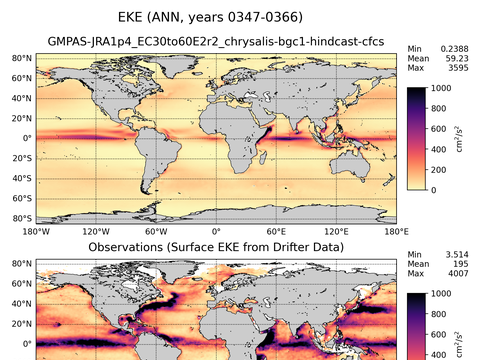
Global Eddy Kinetic Energy
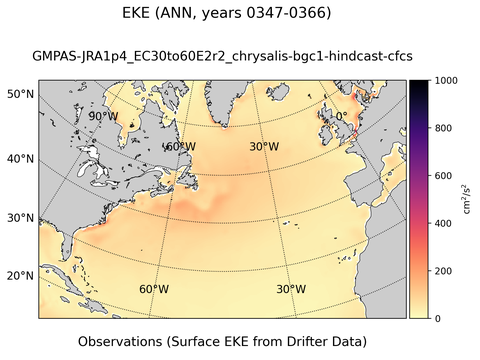
North atlantic Eddy Kinetic Energy
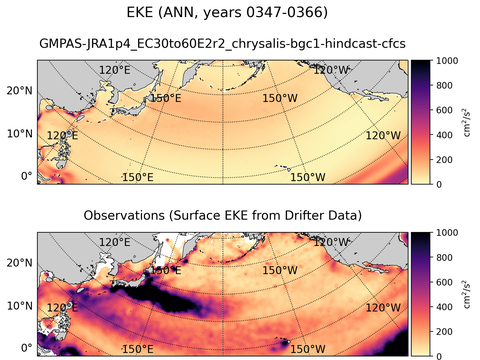
North pacific Eddy Kinetic Energy
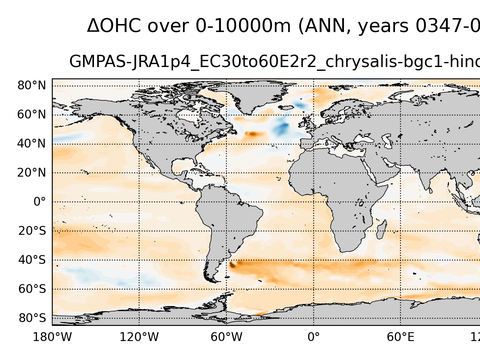
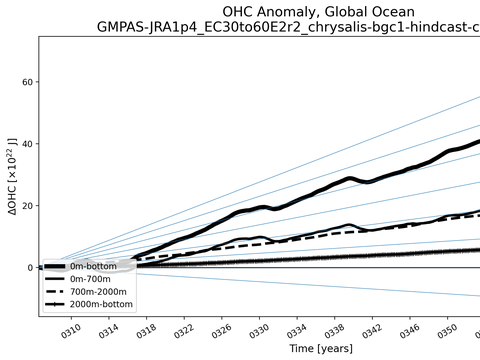
Global OHC Anomaly
Global Potential Temperature
Global Salinity
Global Sea Surface Biogeochemistry
North atlantic Sea Surface Biogeochemistry
North pacific Sea Surface Biogeochemistry
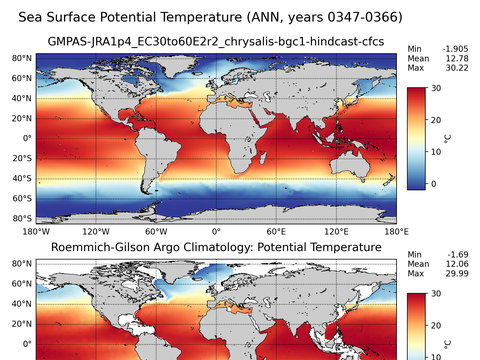
Global Argo Potential Temperature
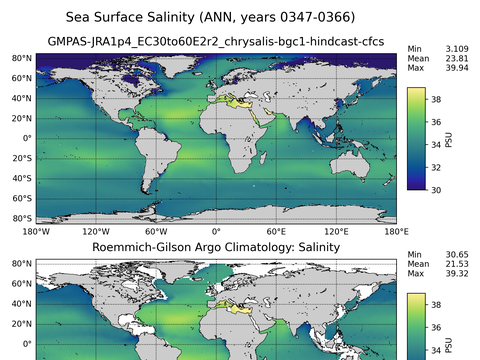
Global Argo Salinity
Antarctic Seafloor Maps
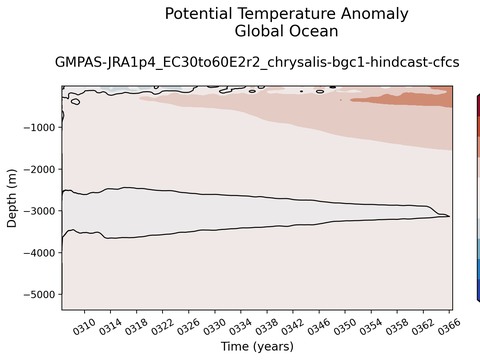
Trends vs Depth
Time Series
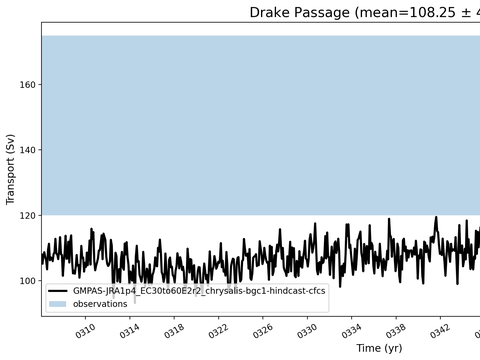
Transport Time Series
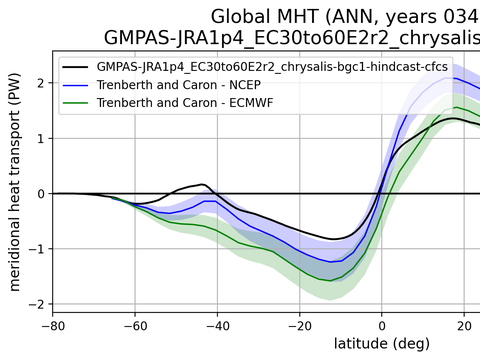
Meridional Heat Transport
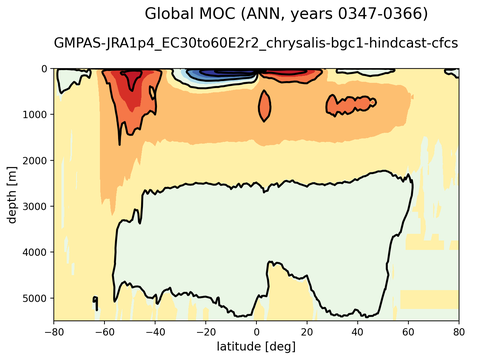
Meridional Overturning Streamfunction
Observations: Holte-Talley ARGO

JFM

JAS

ANN
Observations: Hadley-NOAA-OI

JFM

JAS

ANN
Observations: Hadley-NOAA-OI

JFM

JAS

ANN
Observations: Hadley-NOAA-OI

JFM

JAS

ANN
Observations: Aquarius

JFM

JAS

ANN
Observations: Aquarius

JFM

JAS

ANN
Observations: Aquarius

JFM

JAS

ANN
Observations: AVISO

JFM

JAS

ANN
Observations: EKE from Drifters

ANN
Observations: EKE from Drifters

ANN
Observations: EKE from Drifters

ANN

ANN

ANN

ANN

ANN
WOA18 Climatology

ANN surface

JFM surface

JAS surface

ANN z=-500 m

JFM z=-500 m

JAS z=-500 m

ANN z=-1000 m

JFM z=-1000 m

JAS z=-1000 m
WOA18 Climatology

ANN surface

JFM surface

JAS surface

ANN z=-500 m

JFM z=-500 m

JAS z=-500 m

ANN z=-1000 m

JFM z=-1000 m

JAS z=-1000 m
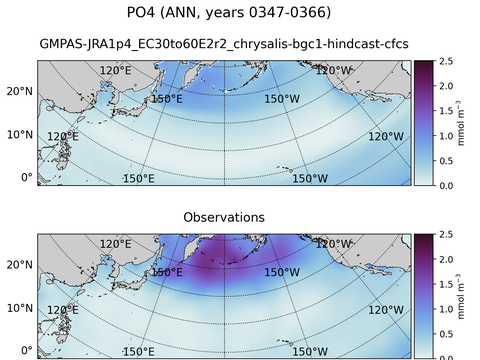
PO4 (Compared to WOA)

ANN

JFM

JAS
NO3 (Compared to WOA)

ANN

JFM

JAS
SiO3 (Compared to WOA)

ANN

JFM

JAS
CO2 Flux (Compared to SOM-FFNv2016)

ANN

JFM

JAS
pH (Compared to GLODAPv2)

ANN

JFM

JAS
DIC (Compared to GLODAPv2)

ANN

JFM

JAS
Alkalinity (Compared to GLODAPv2)

ANN

JFM

JAS
O2 (Compared to WOA)

ANN

JFM

JAS
pCO2 (Compared to SOM-FFNv2016)

ANN

JFM

JAS
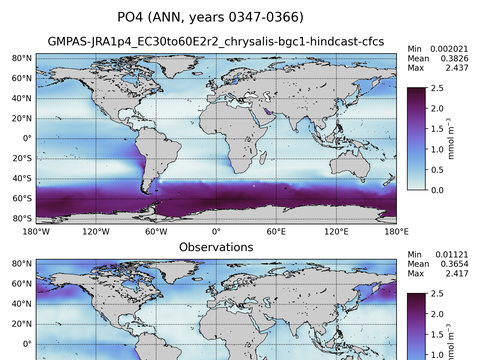
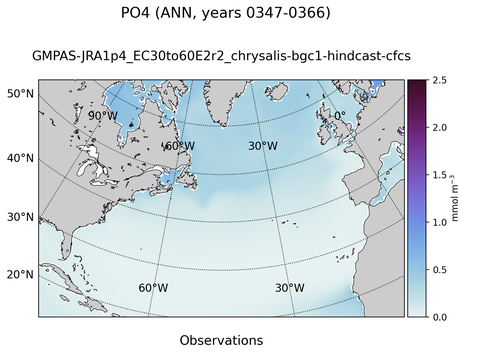
Roemmich-Gilson Climatology: Argo

ANN surface

ANN z=-25 m

ANN z=-50 m

ANN z=-100 m

ANN z=-150 m

ANN z=-200 m

ANN z=-400 m

ANN z=-800 m

ANN z=-1500 m

JAS surface

JAS z=-25 m

JAS z=-50 m

JAS z=-100 m

JAS z=-150 m

JAS z=-200 m

JAS z=-400 m

JAS z=-800 m

JAS z=-1500 m

JFM surface

JFM z=-25 m

JFM z=-50 m

JFM z=-100 m

JFM z=-150 m

JFM z=-200 m

JFM z=-400 m

JFM z=-800 m

JFM z=-1500 m
Roemmich-Gilson Climatology: Argo

ANN surface

ANN z=-25 m

ANN z=-50 m

ANN z=-100 m

ANN z=-150 m

ANN z=-200 m

ANN z=-400 m

ANN z=-600 m

ANN z=-800 m

ANN z=-1500 m

JFM surface

JFM z=-25 m

JFM z=-50 m

JFM z=-100 m

JFM z=-150 m

JFM z=-200 m

JFM z=-400 m

JFM z=-600 m

JFM z=-800 m

JFM z=-1500 m

JAS surface

JAS z=-25 m

JAS z=-50 m

JAS z=-100 m

JAS z=-150 m

JAS z=-200 m

JAS z=-400 m

JAS z=-600 m

JAS z=-800 m

JAS z=-1500 m
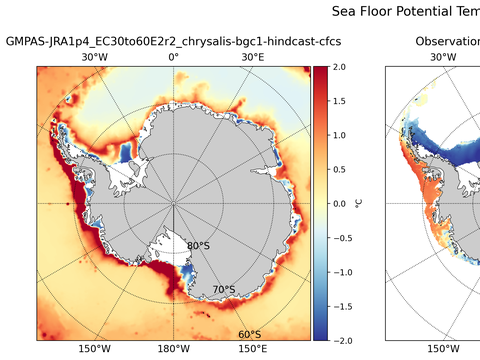
Potential Temperature

ANN floor

JFM floor

JAS floor
Salinity

ANN floor

JFM floor

JAS floor
Potential Density

ANN floor

JFM floor

JAS floor

Global Ocean Δϴ

Global Ocean ΔS

Global Ocean ΔOHC

global ΔOHC

SSH Anomaly

global SST

Drake Passage

Tasmania-Ant

Africa-Ant

Antilles Inflow

Mona Passage

Windward Passage

Florida-Cuba

Florida-Bahamas

Indonesian Throughflow

Agulhas

Mozambique Channel

Bering Strait

Lancaster Sound

Fram Strait

Nares Strait

Denmark Strait

Iceland-Faroe-Scotland


Global

Atlantic

AtlanticMed

IndoPacific

Time Series