E3SM chemistry diagnostics package (ChemDyg) Test: 20220914.PAN.MZThet.v2.LR.bi-grid.amip.chemUCI_Linozv3
Reference: Observations and Reanalysis
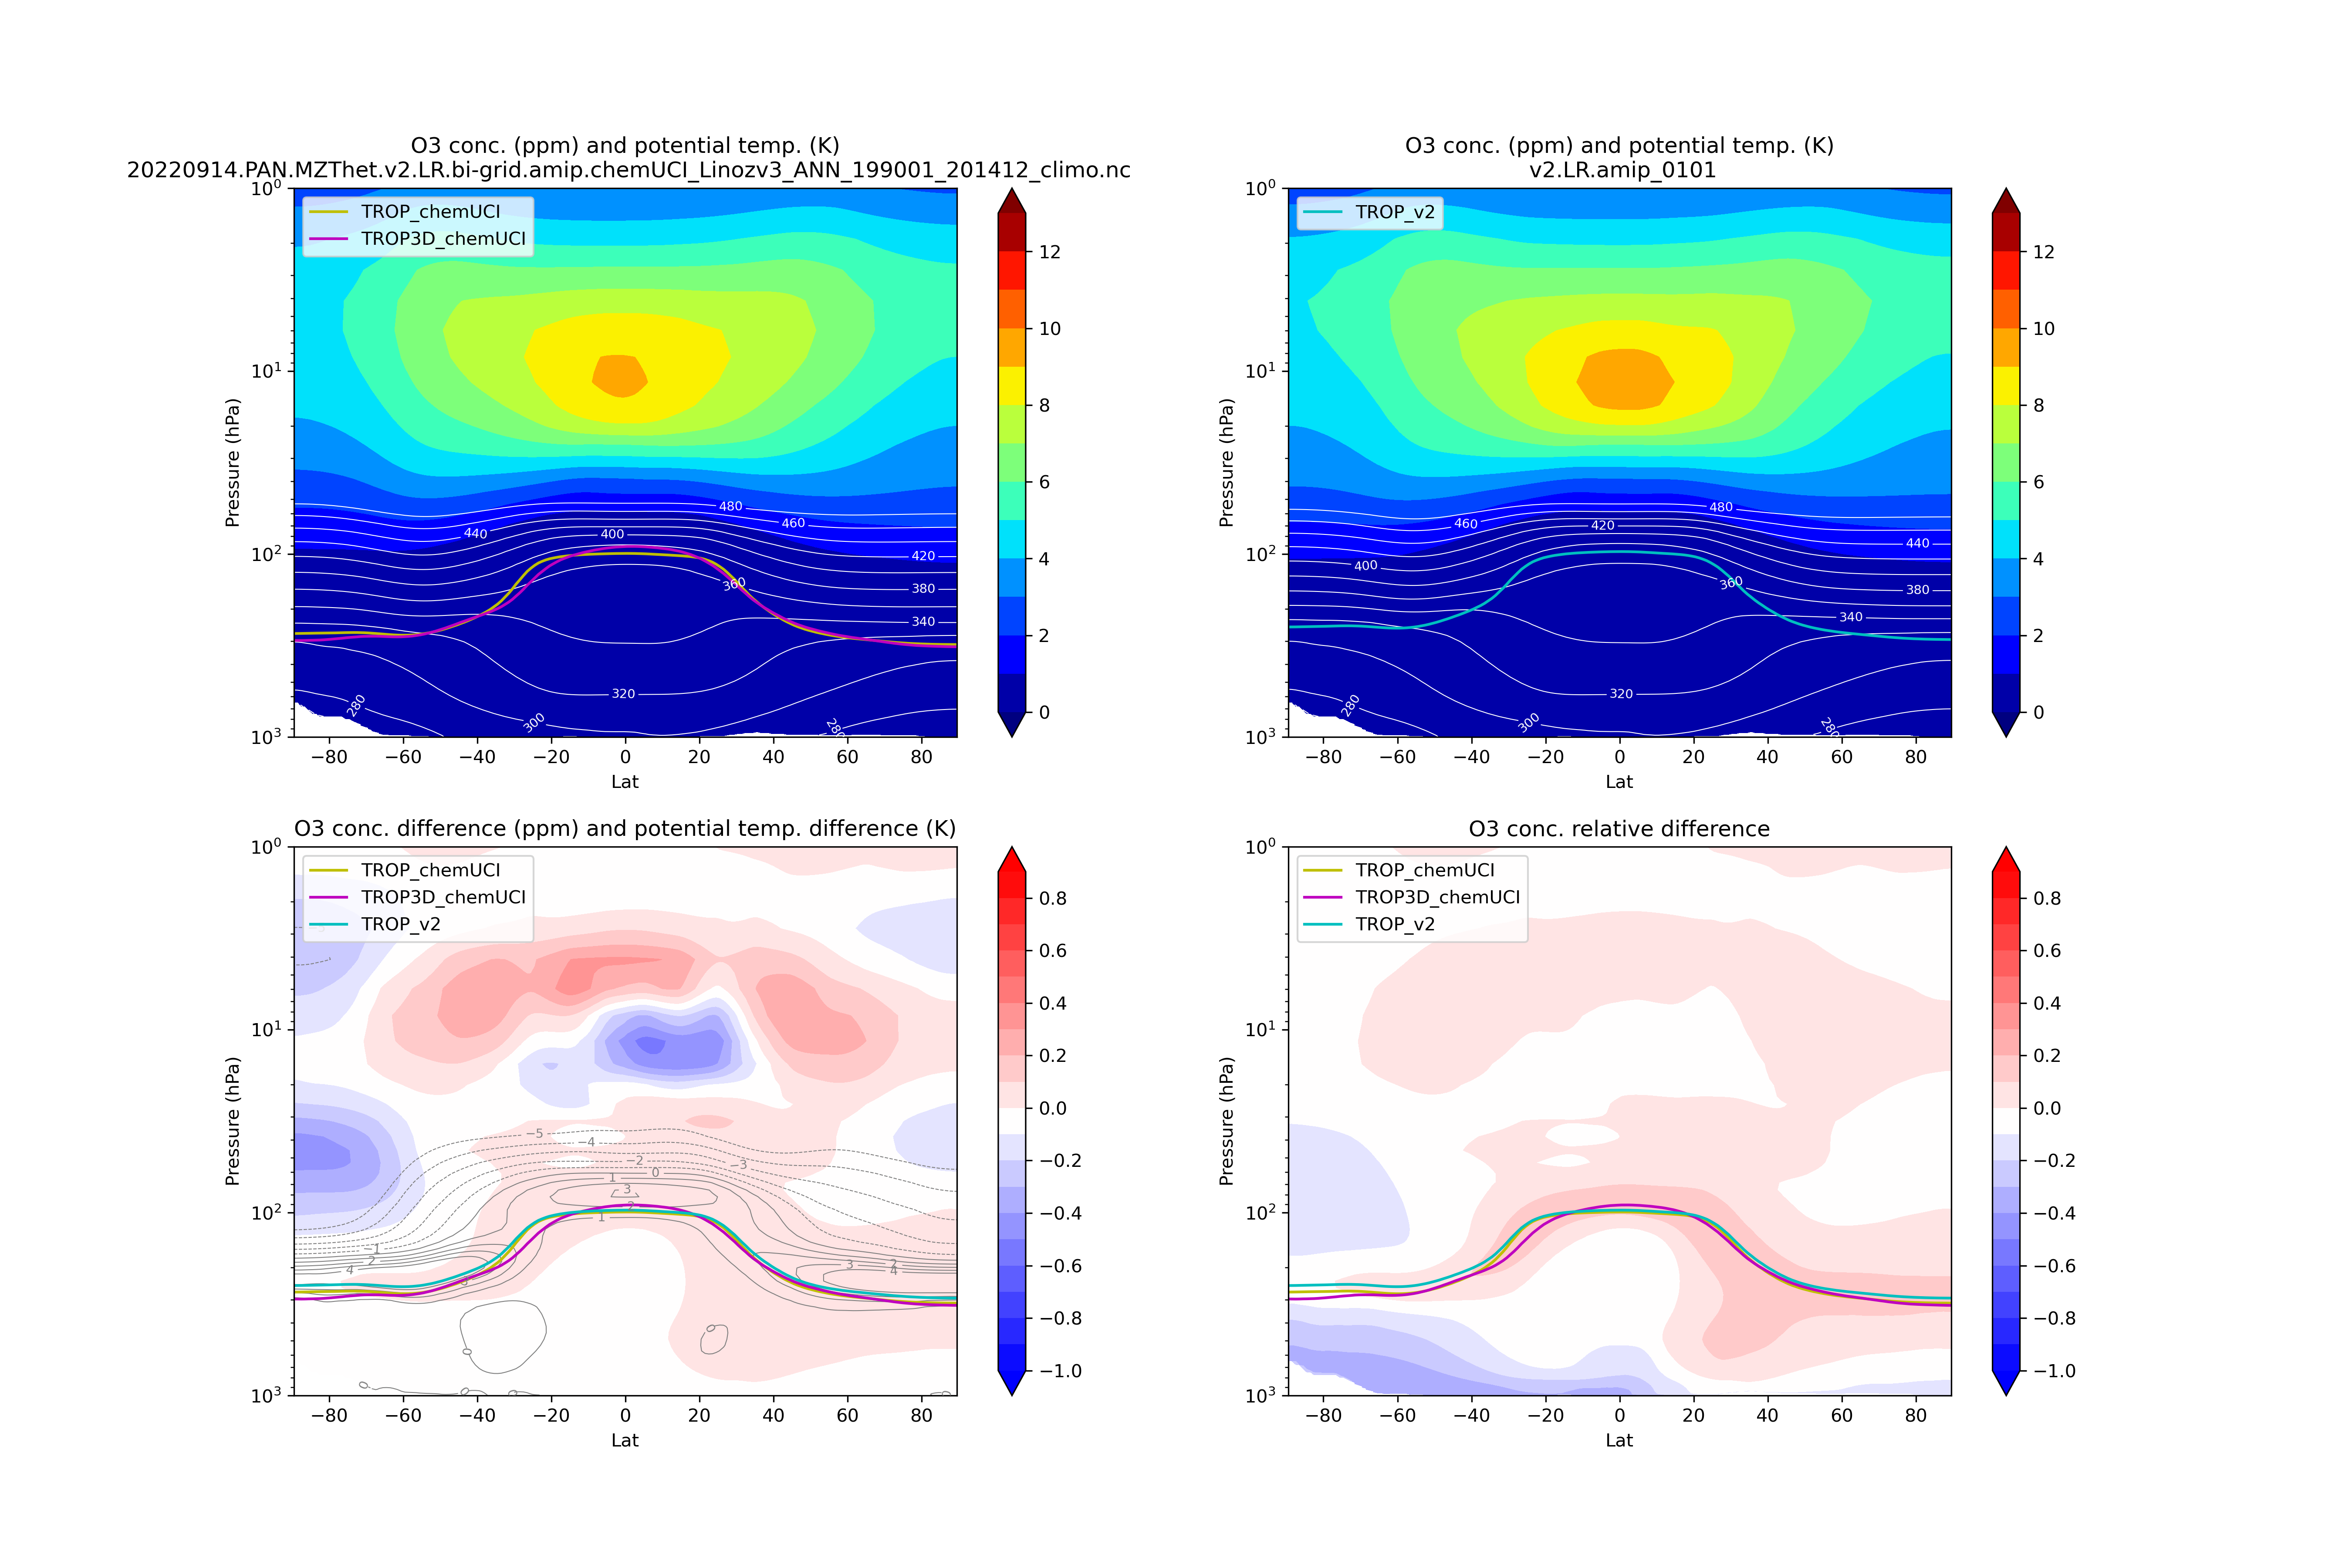
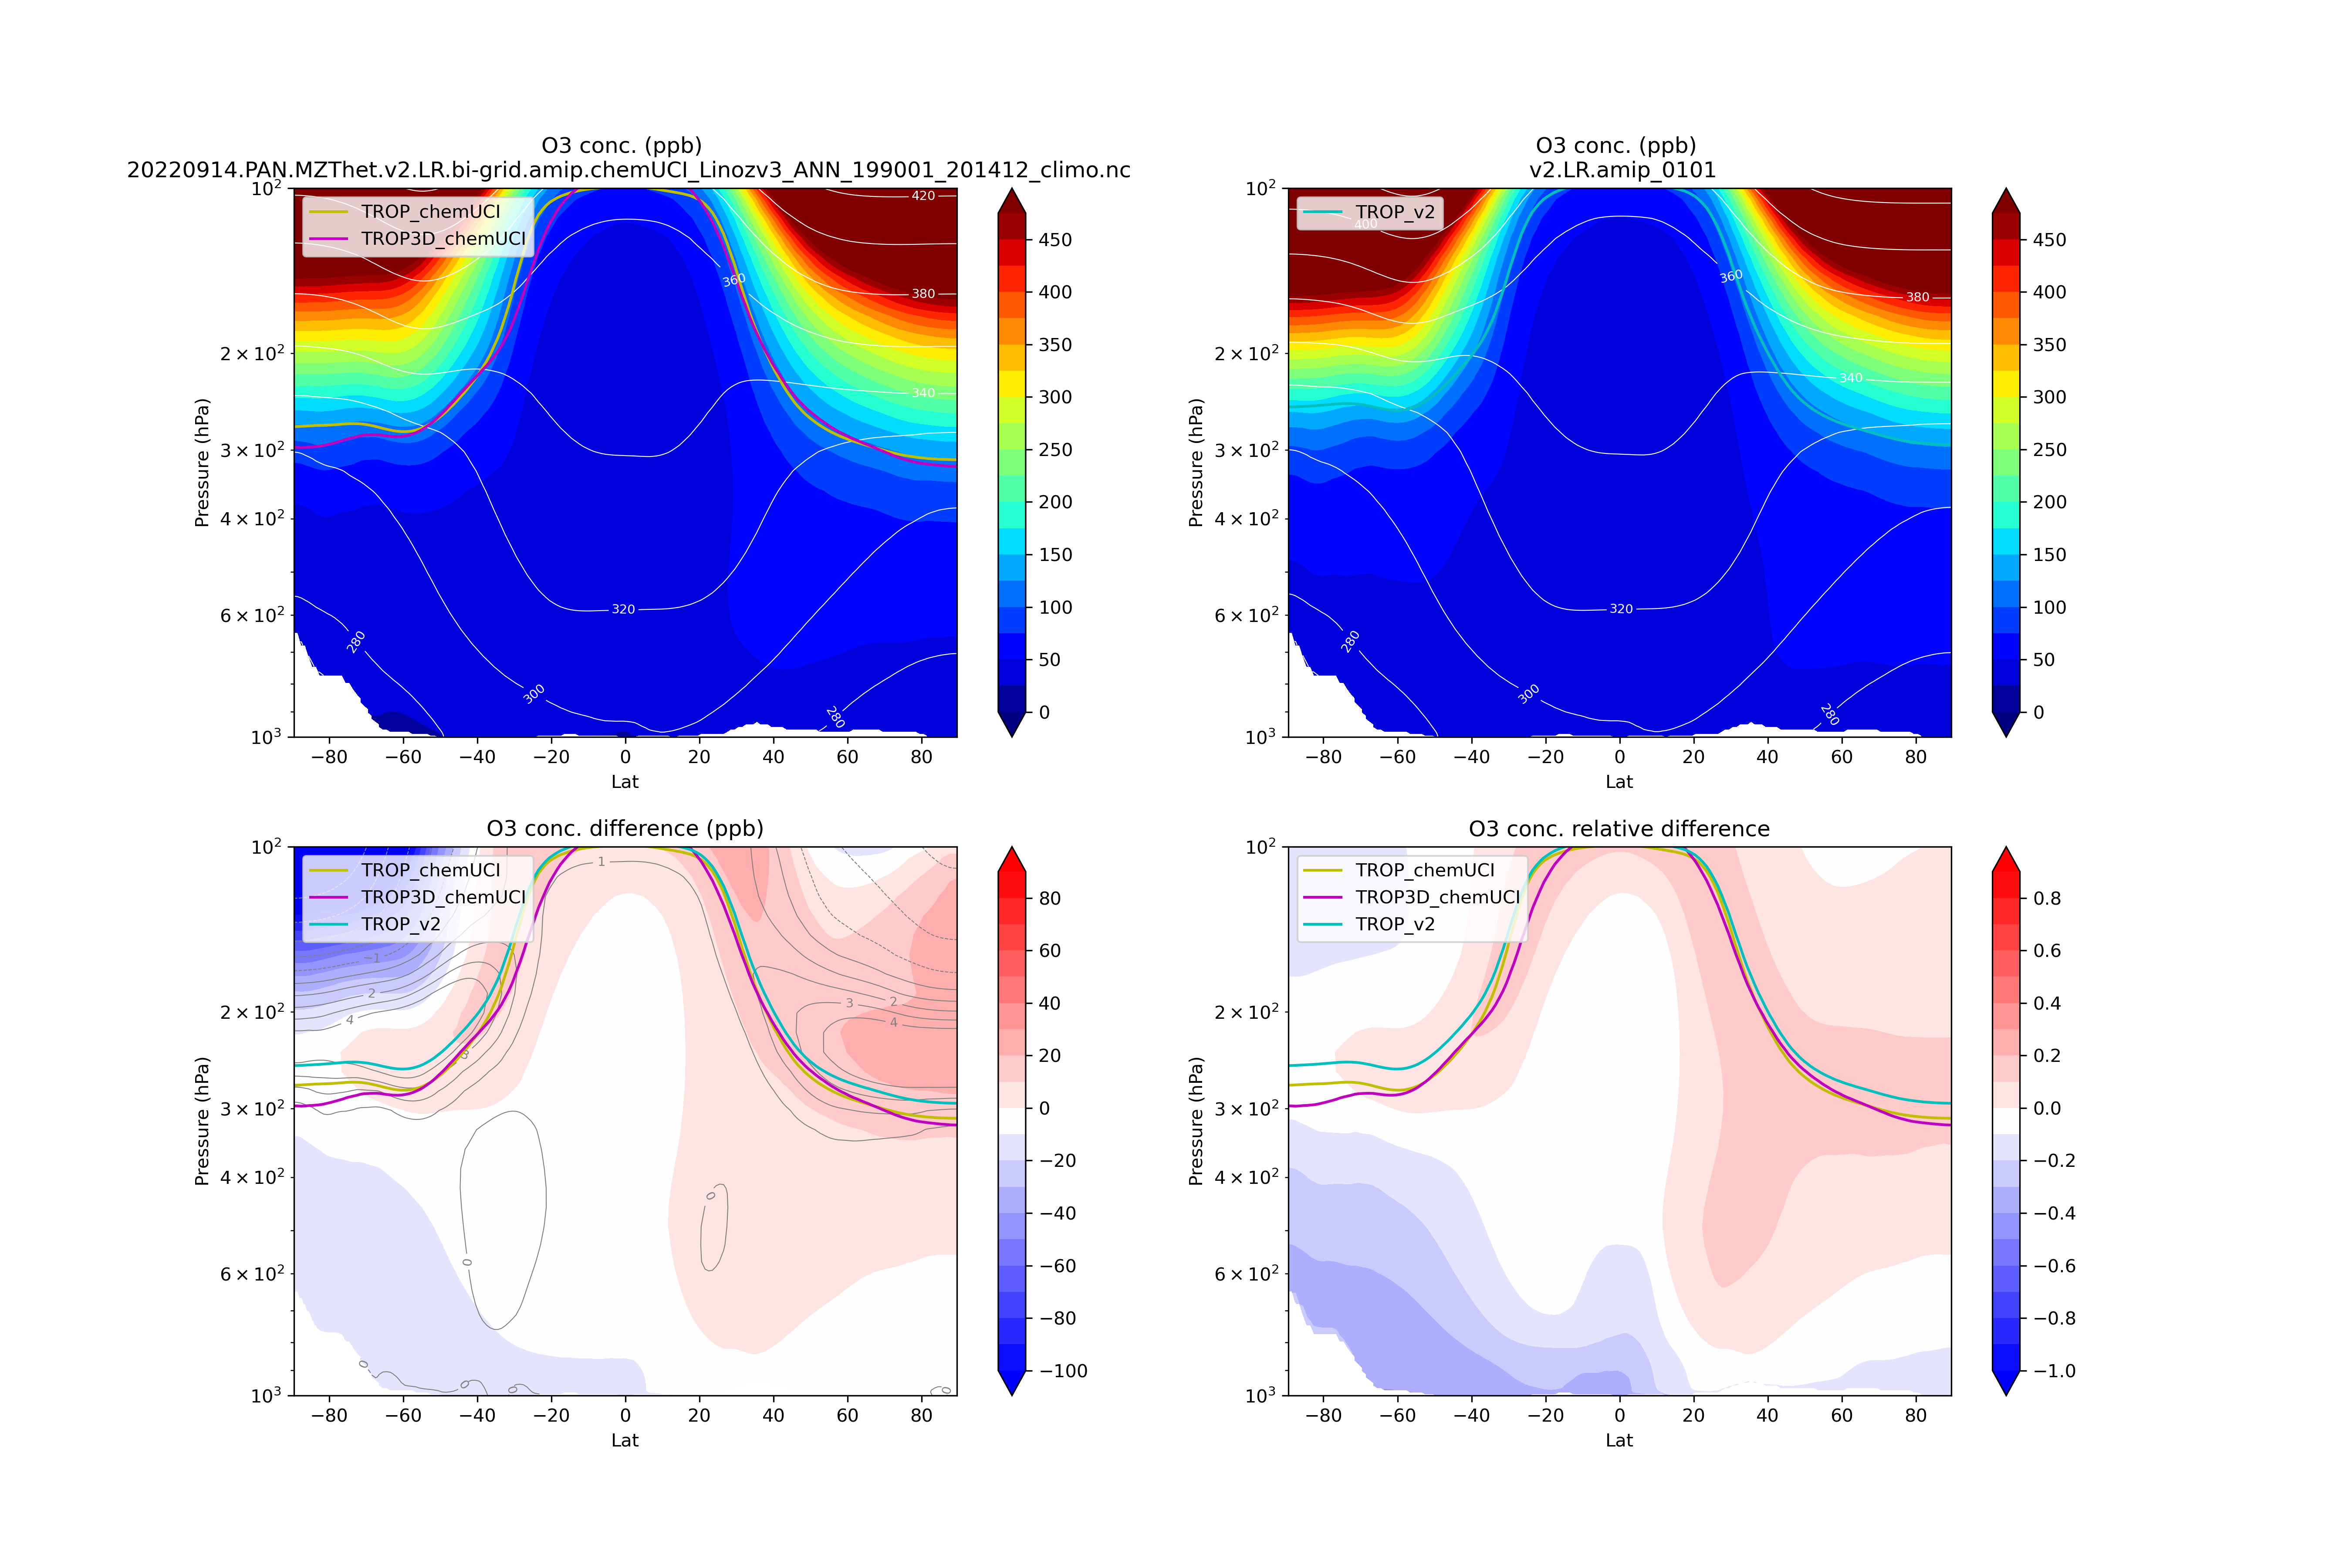
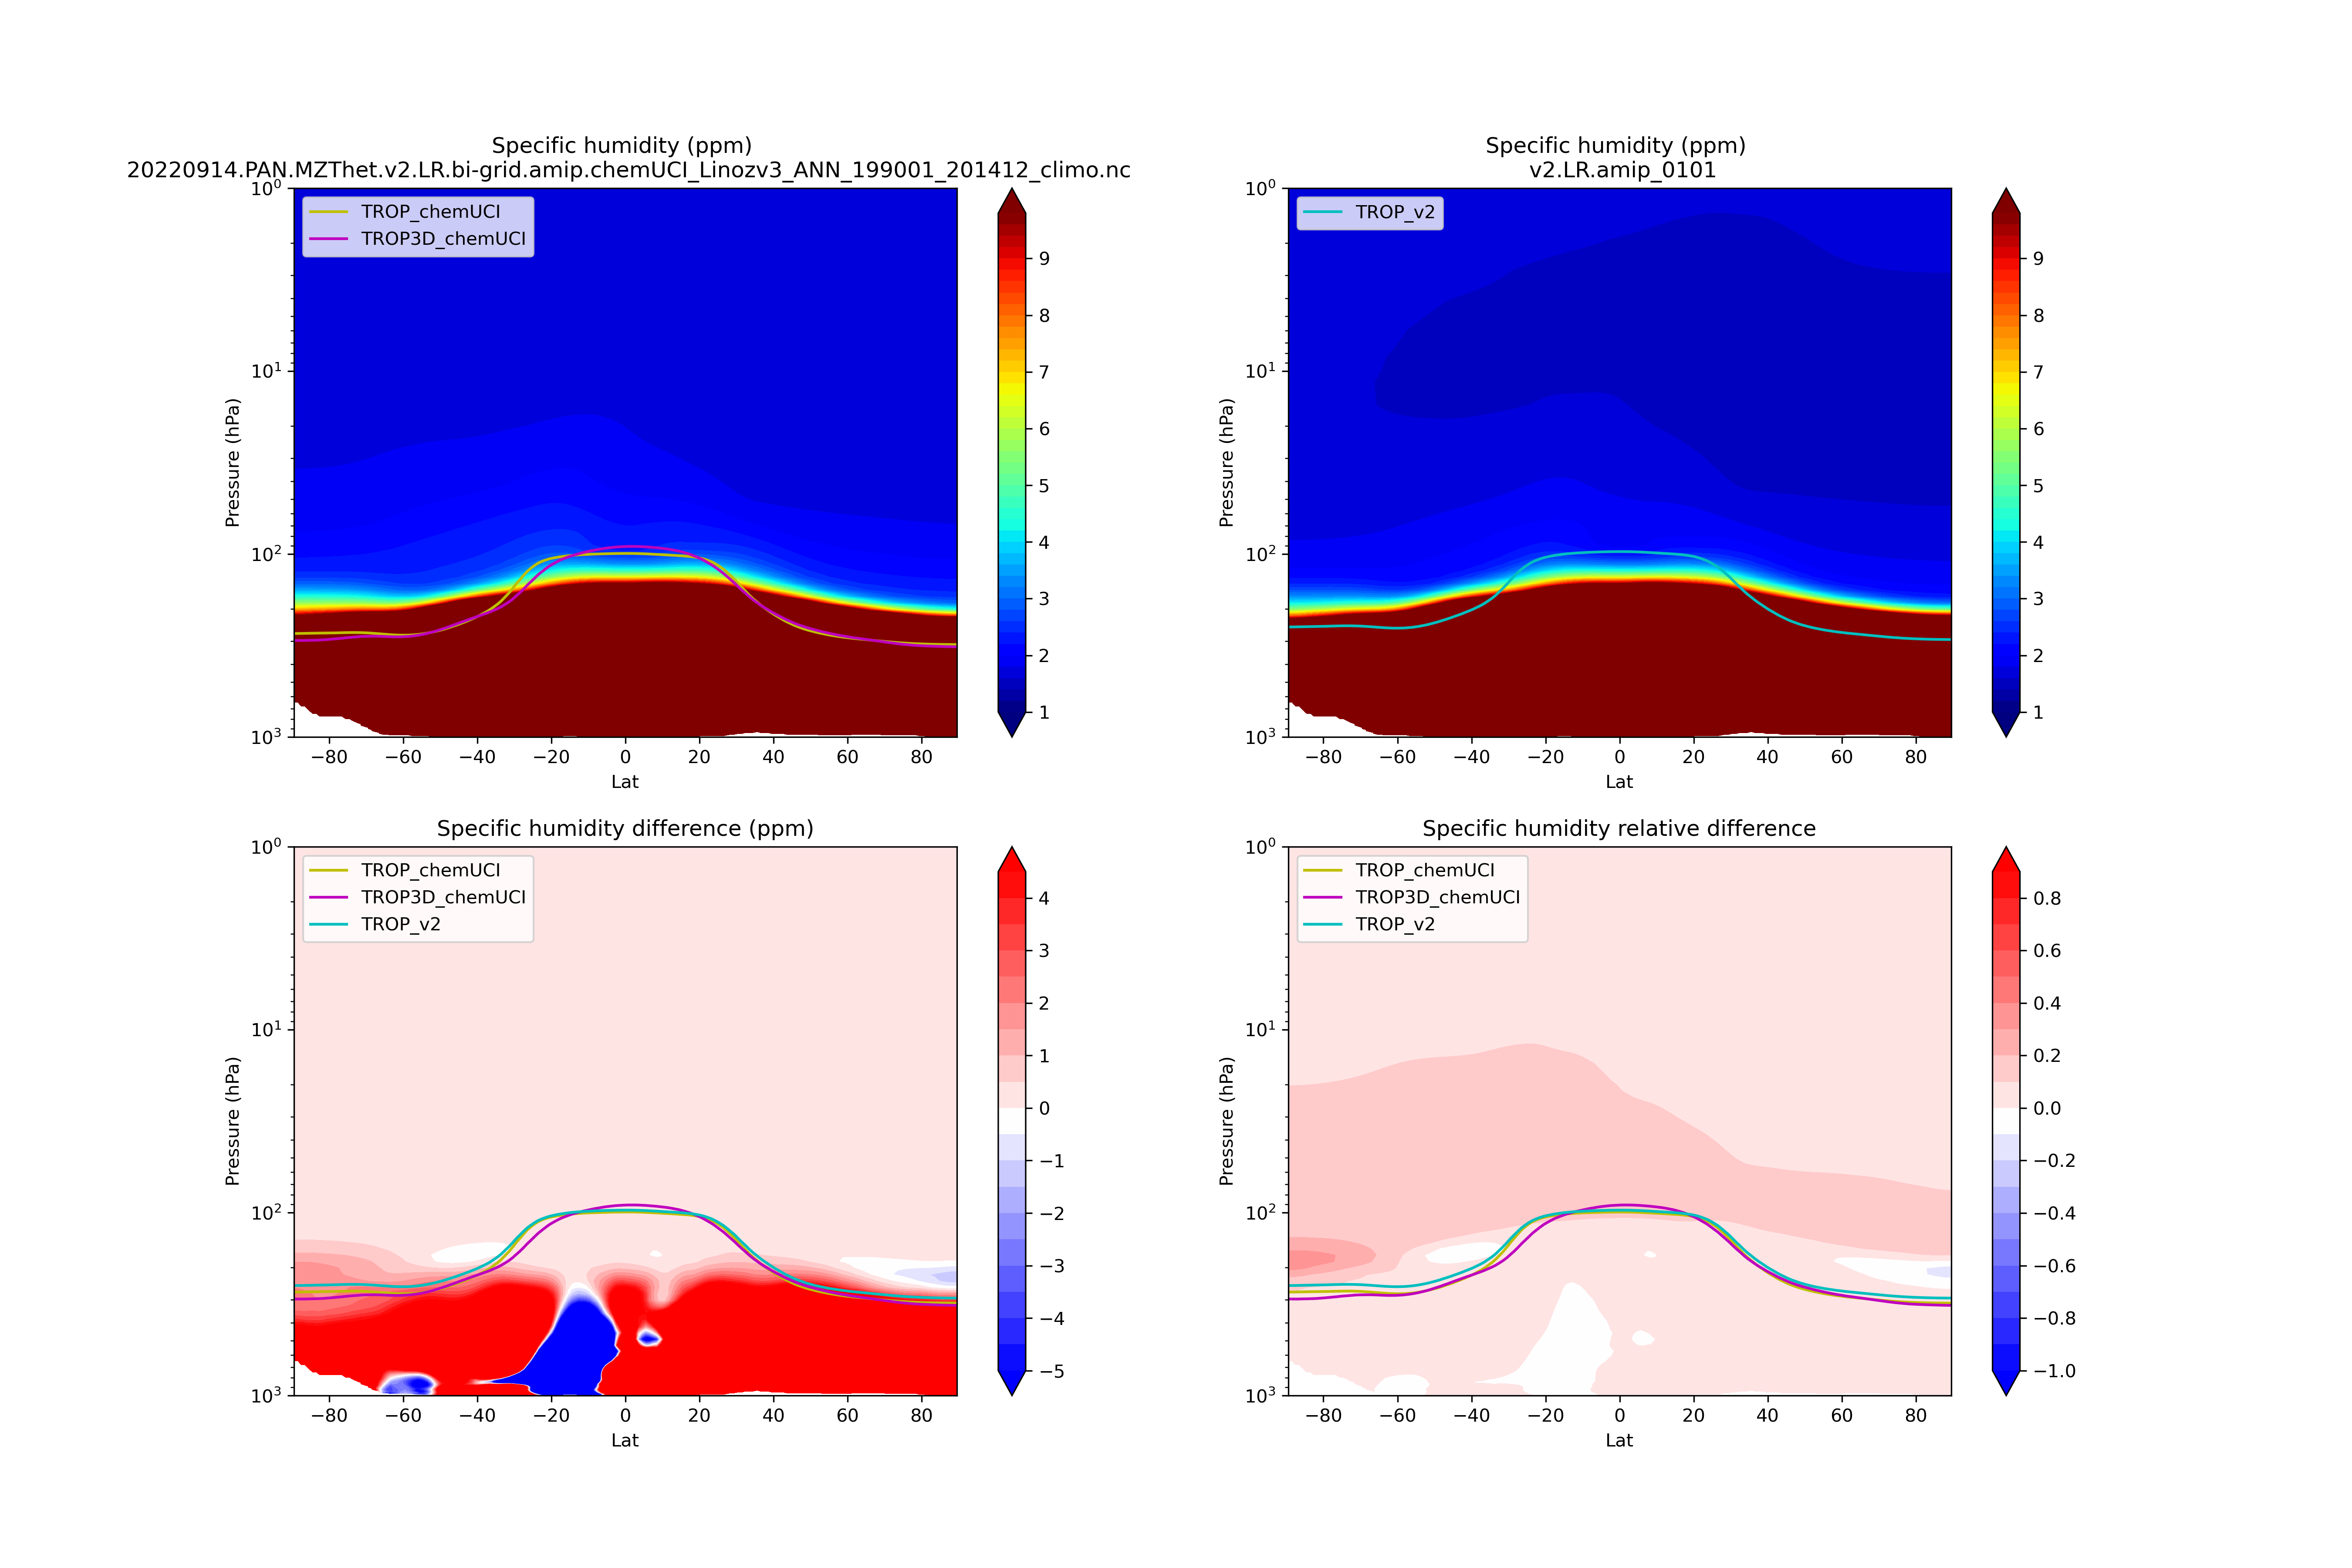
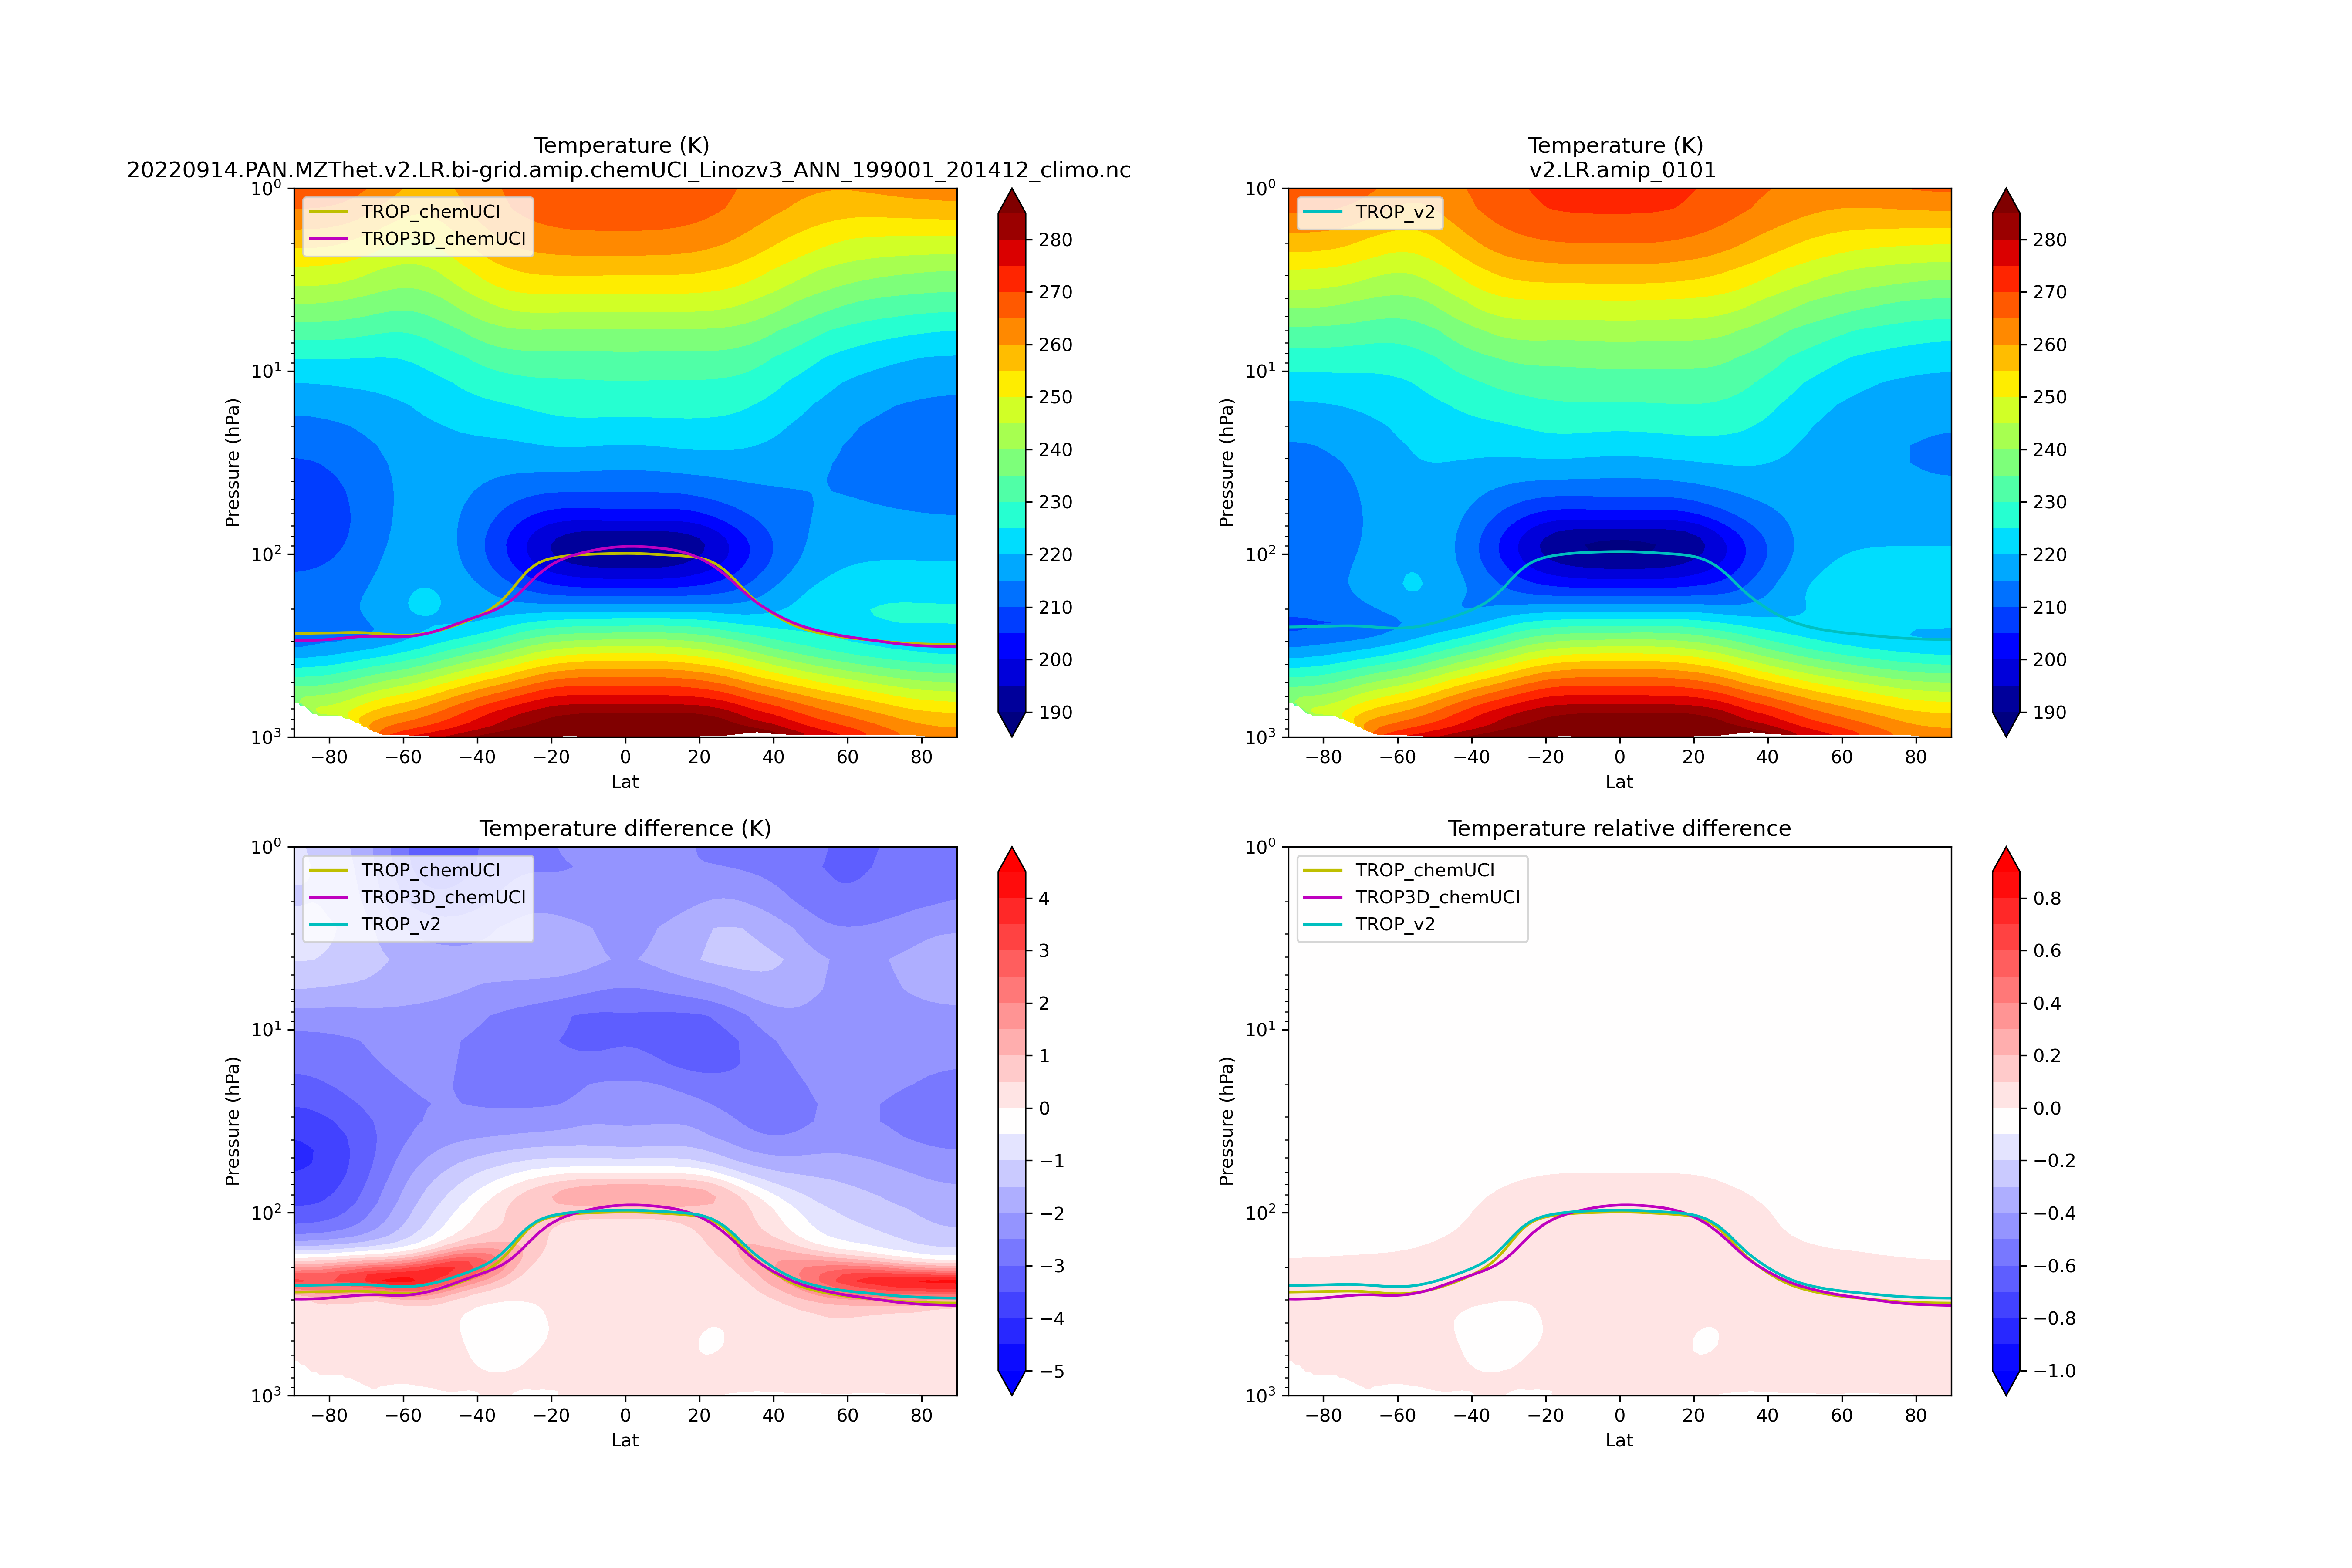
Pressure-Latitude plots O3 O3 (Trop) Q T
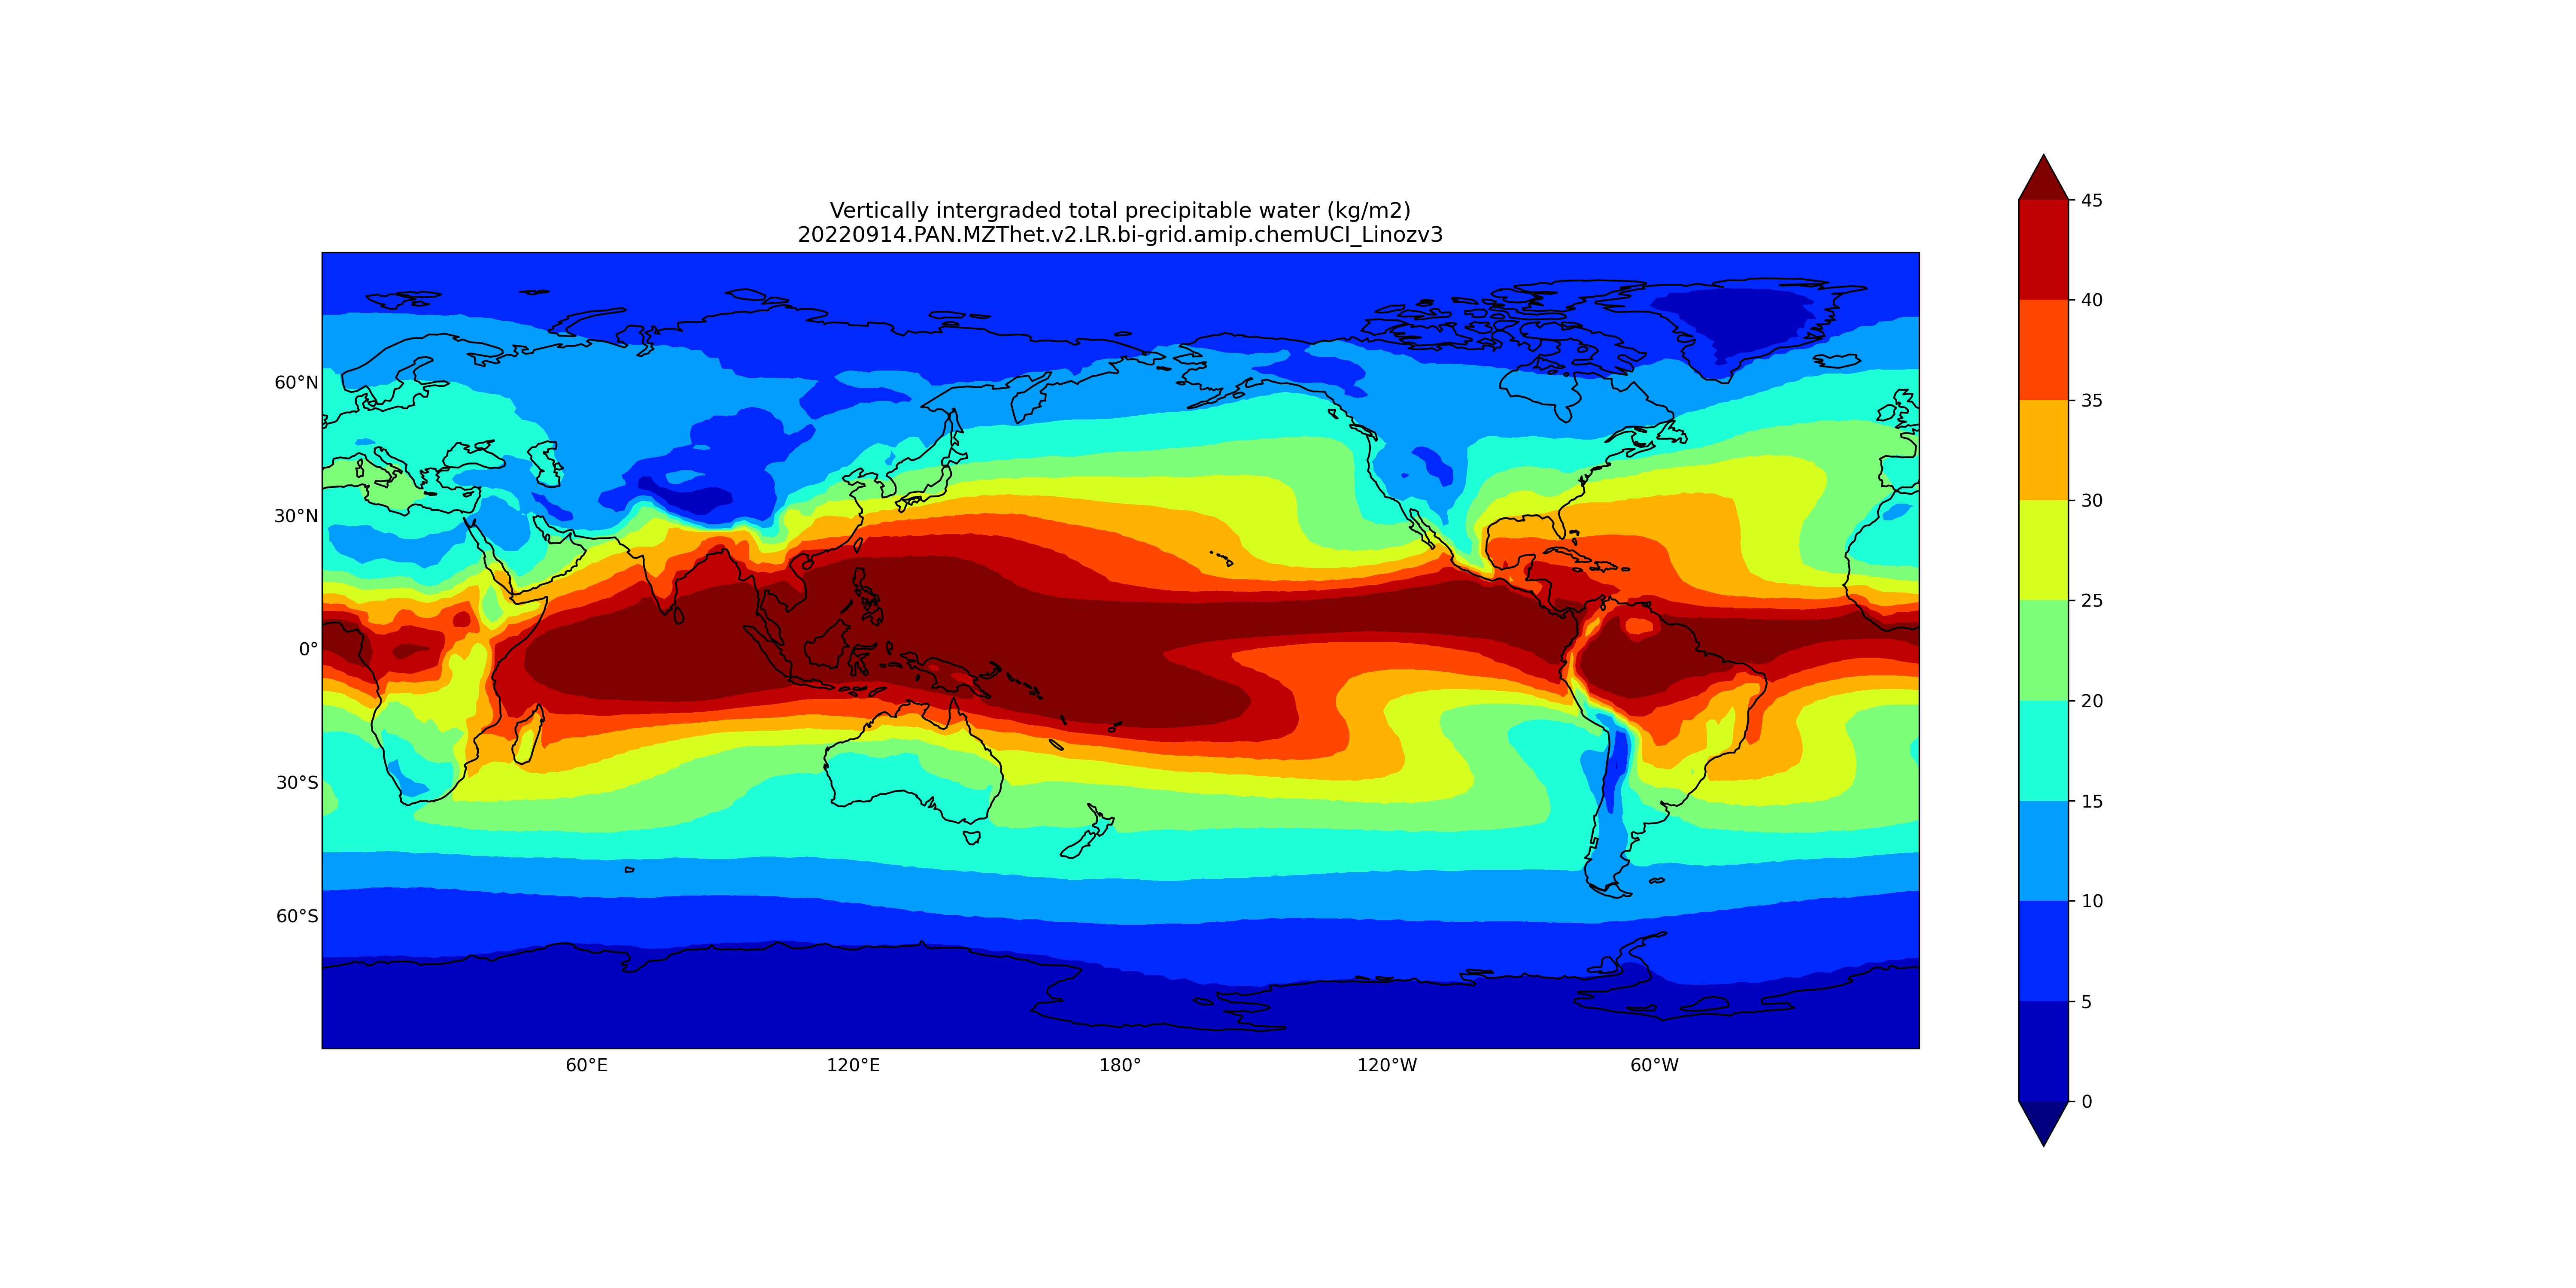
Latitude-Longitude plots TMQ
NOx aircraft and lightning emission plots NOx emission
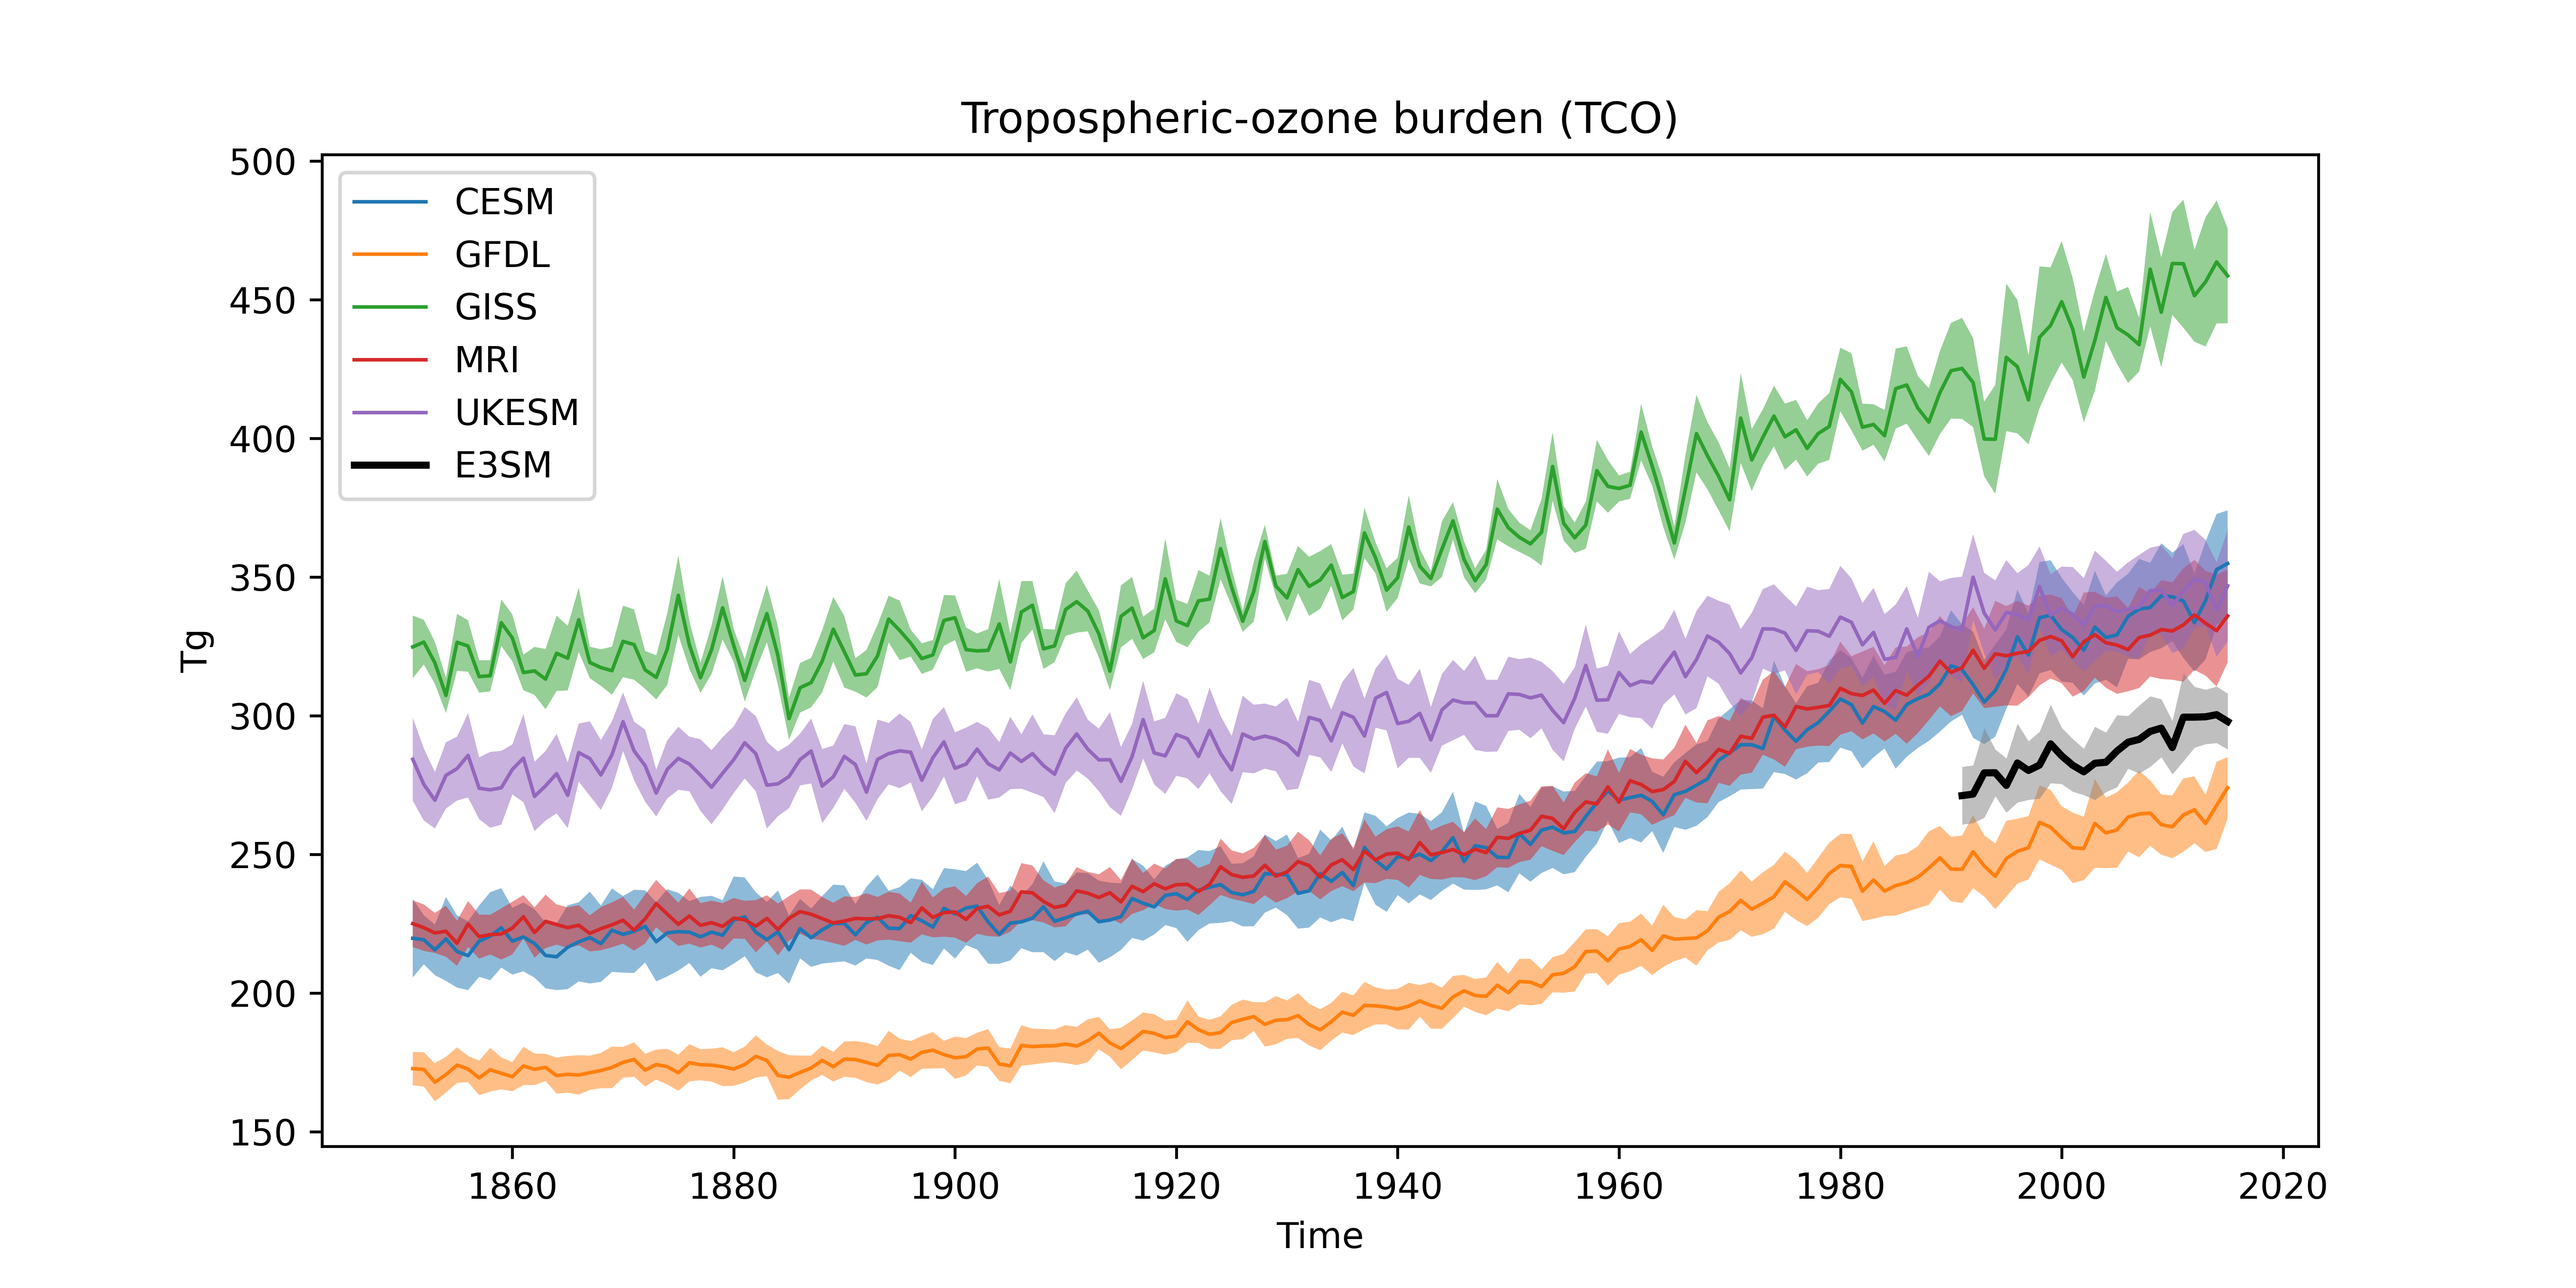
TCO comparison with CMIP6 plot
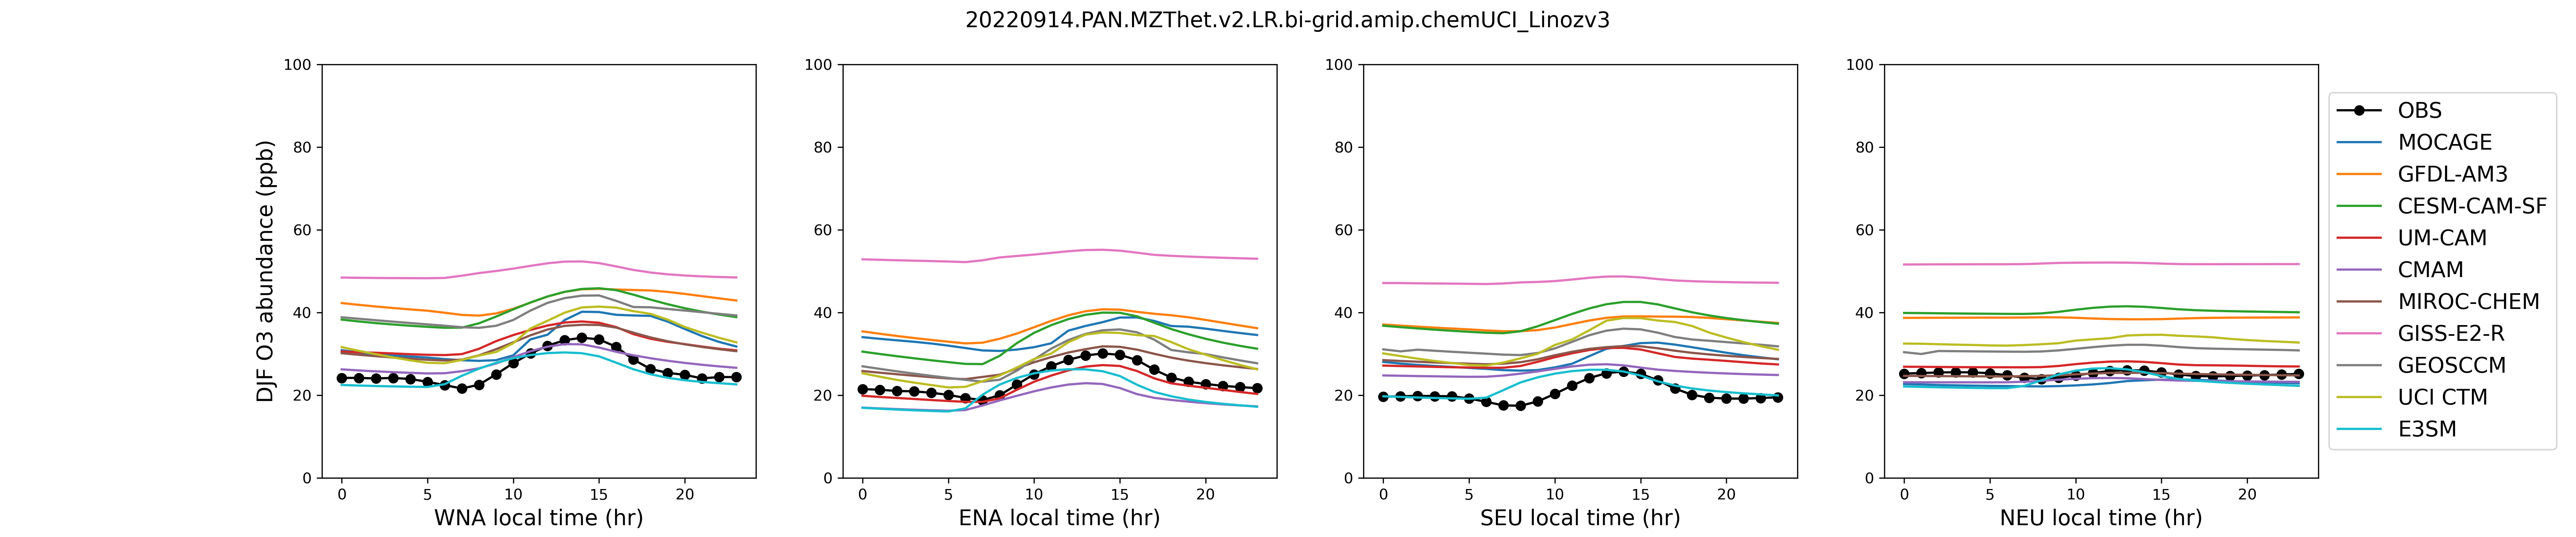
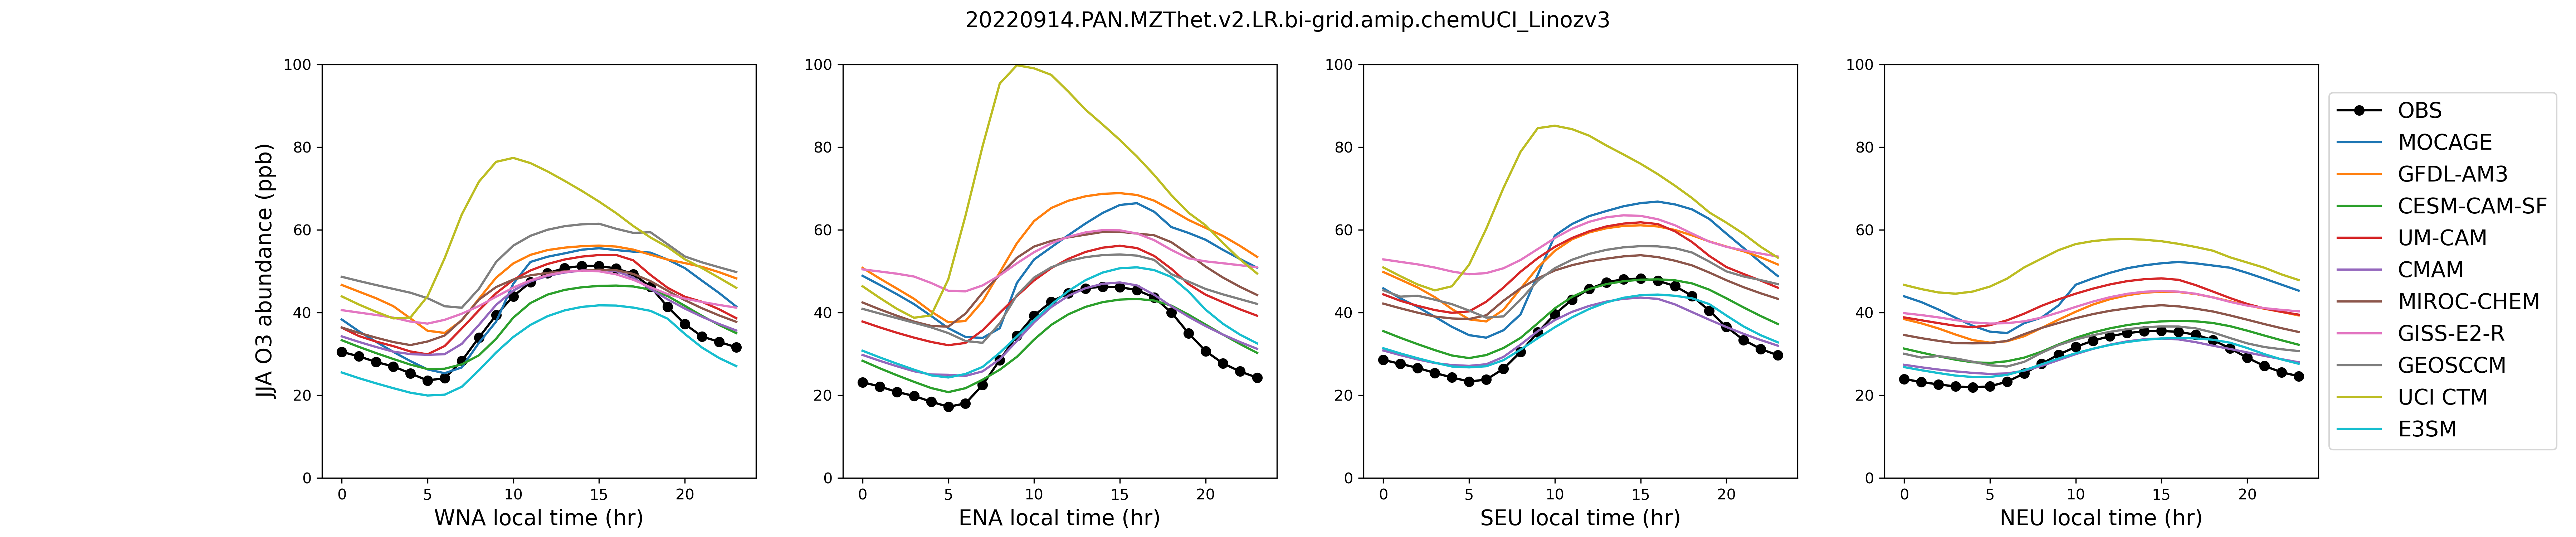
Surface Ozone diurnal cycle comparison with CMIP6 DJF JJA
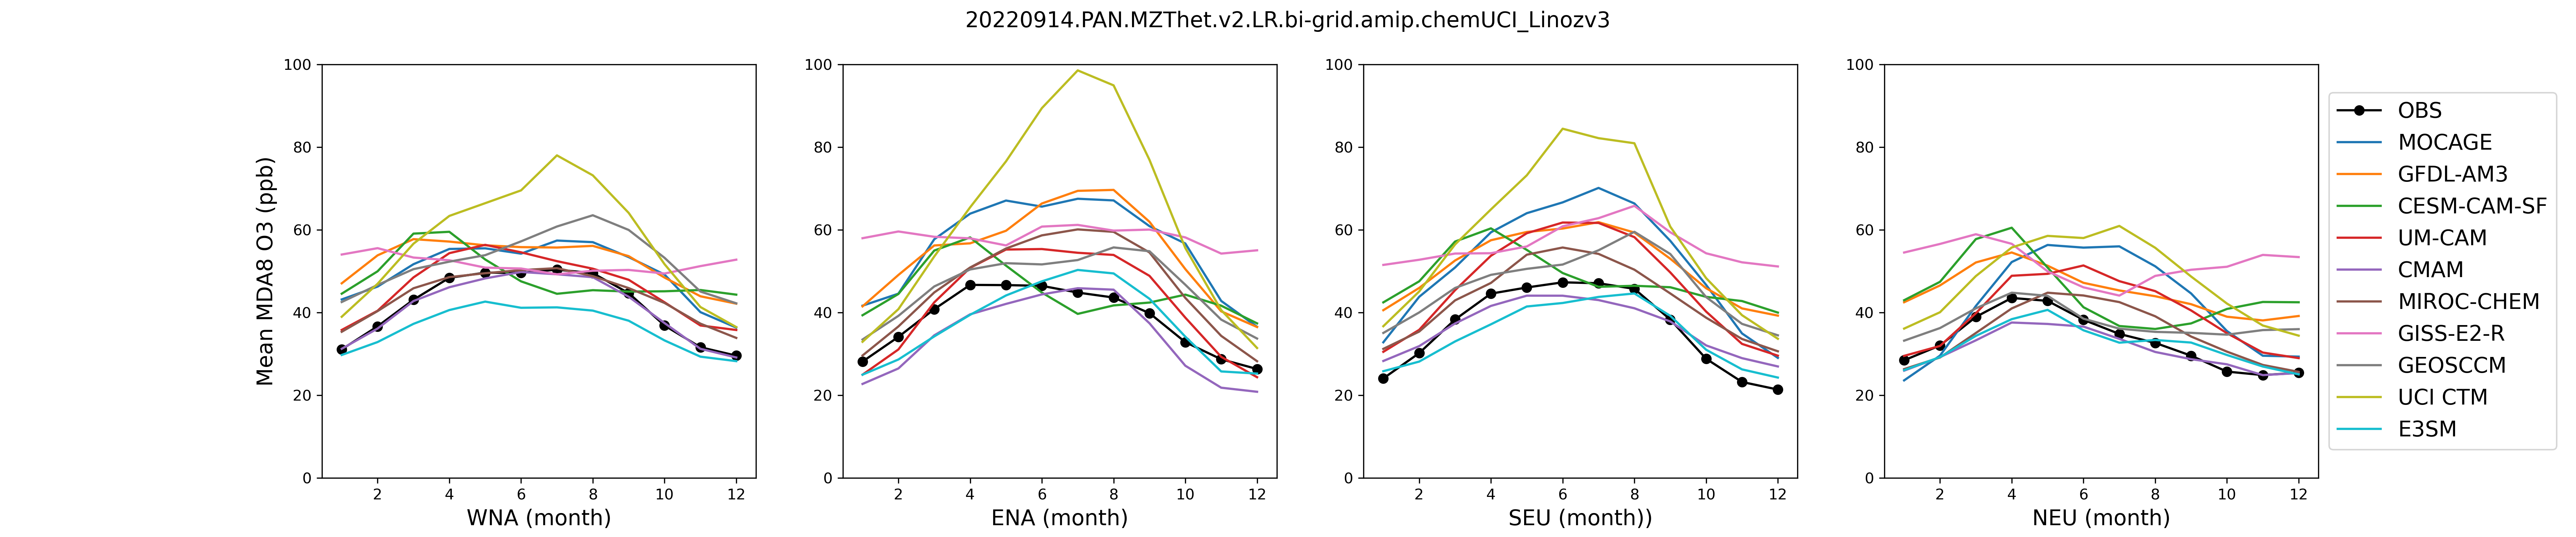
Surface Ozone annual cycle comparison with CMIP6 plot
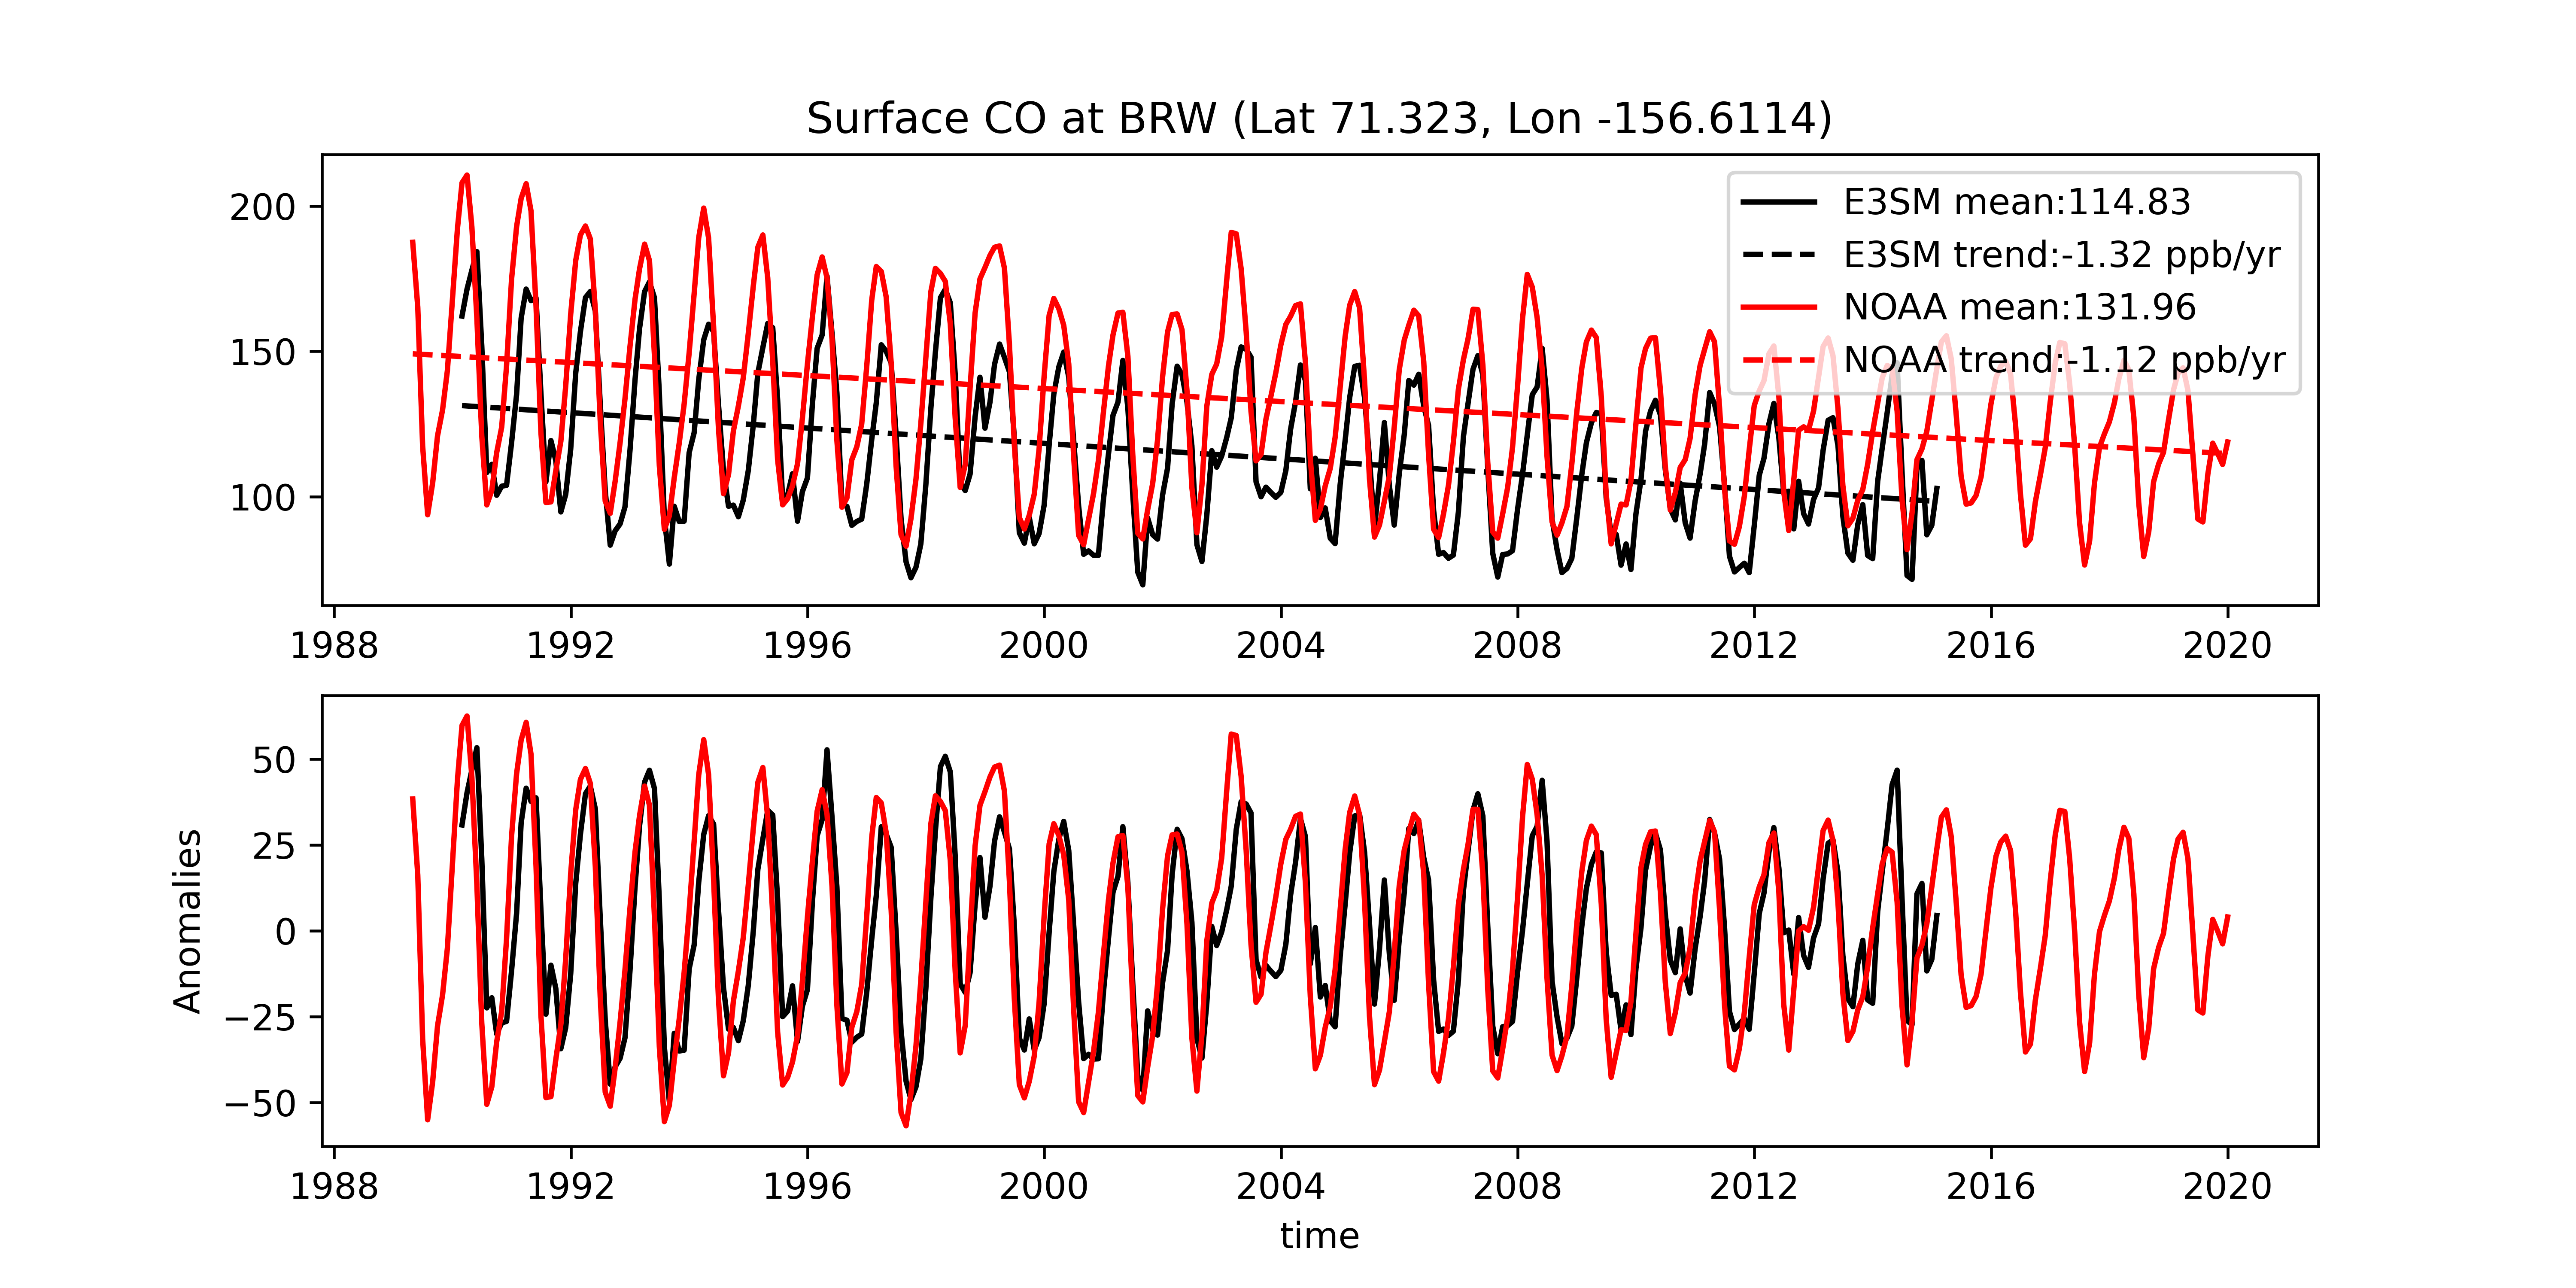
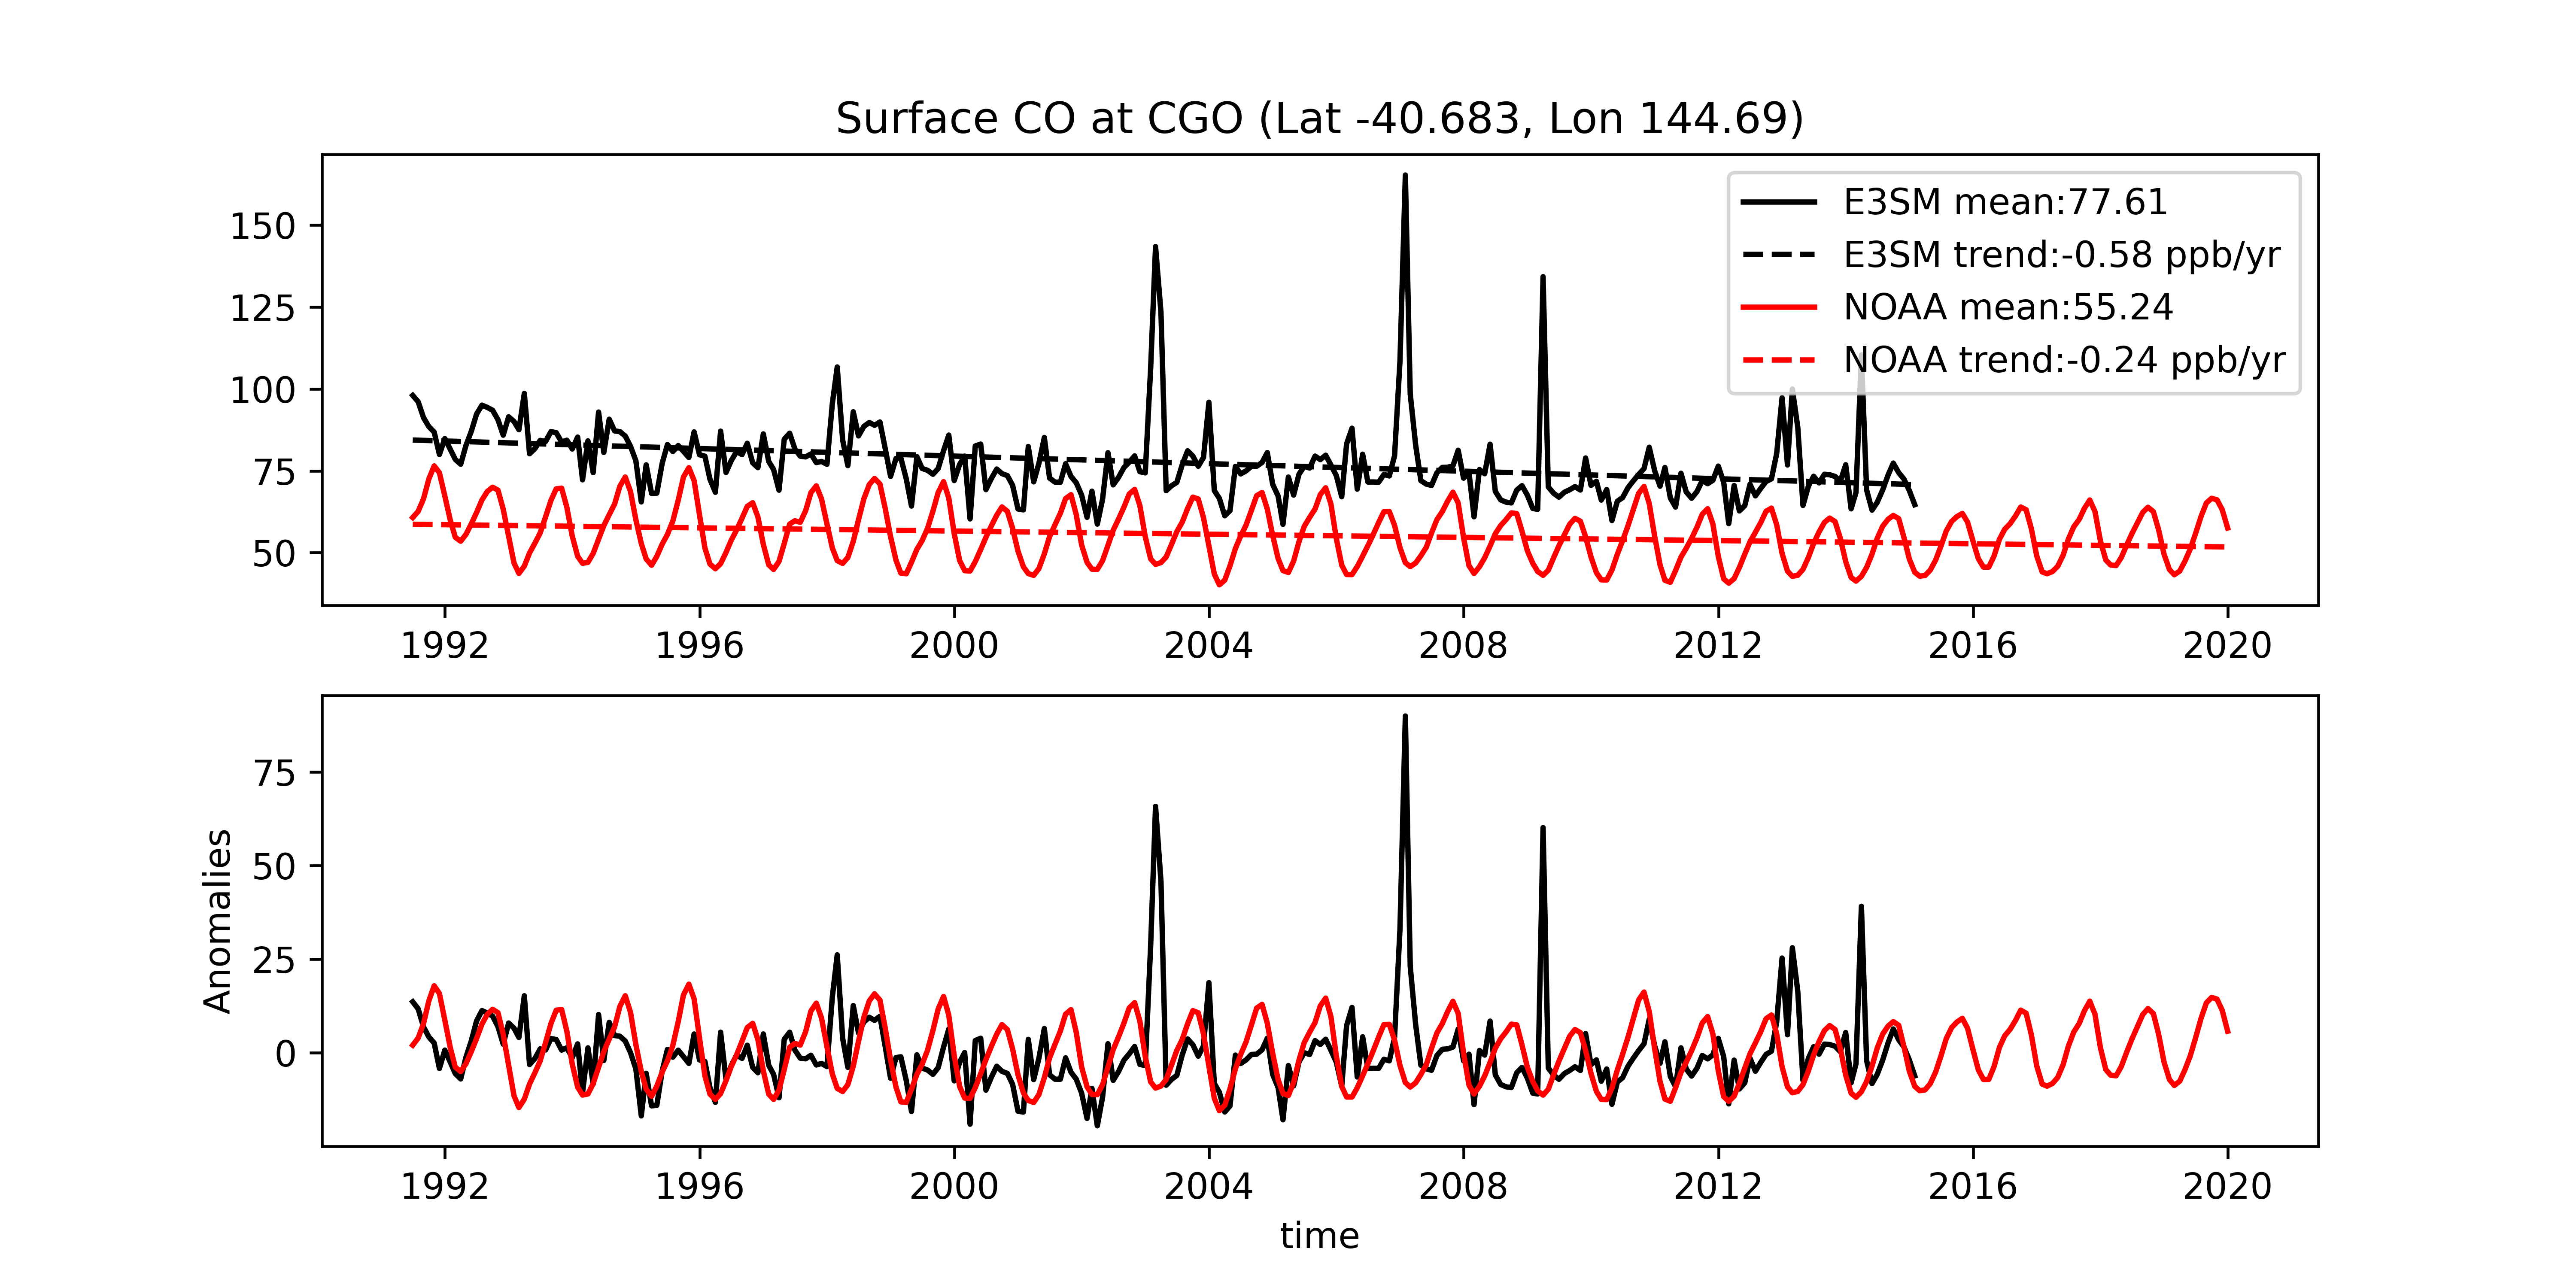
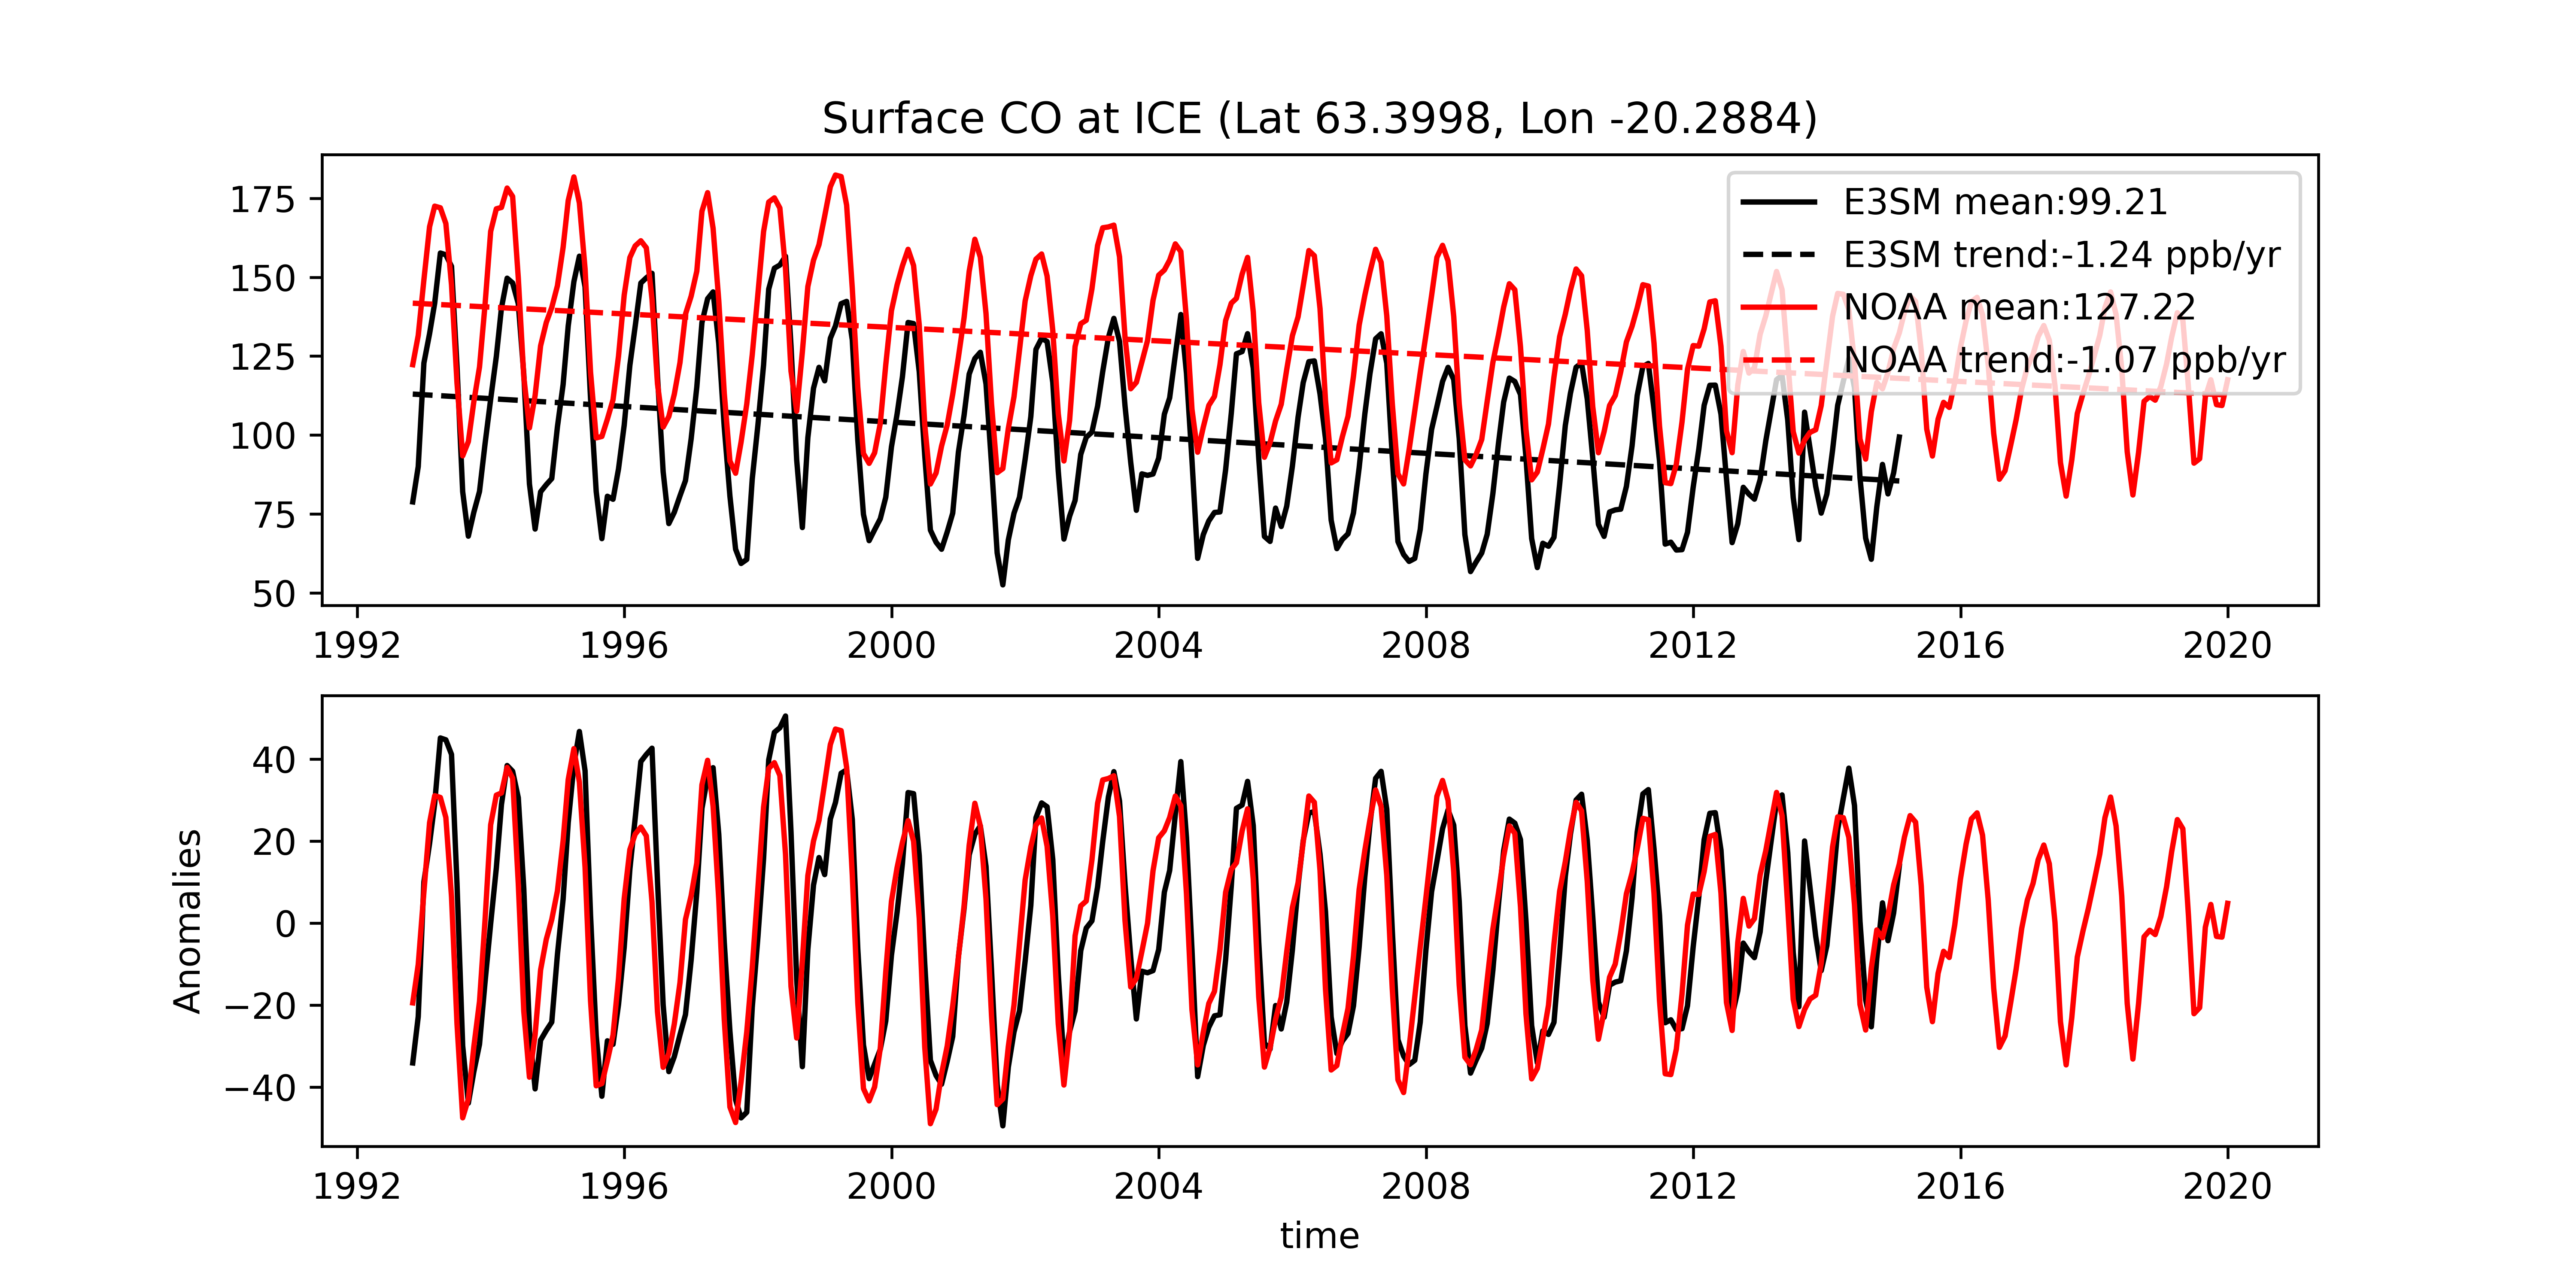
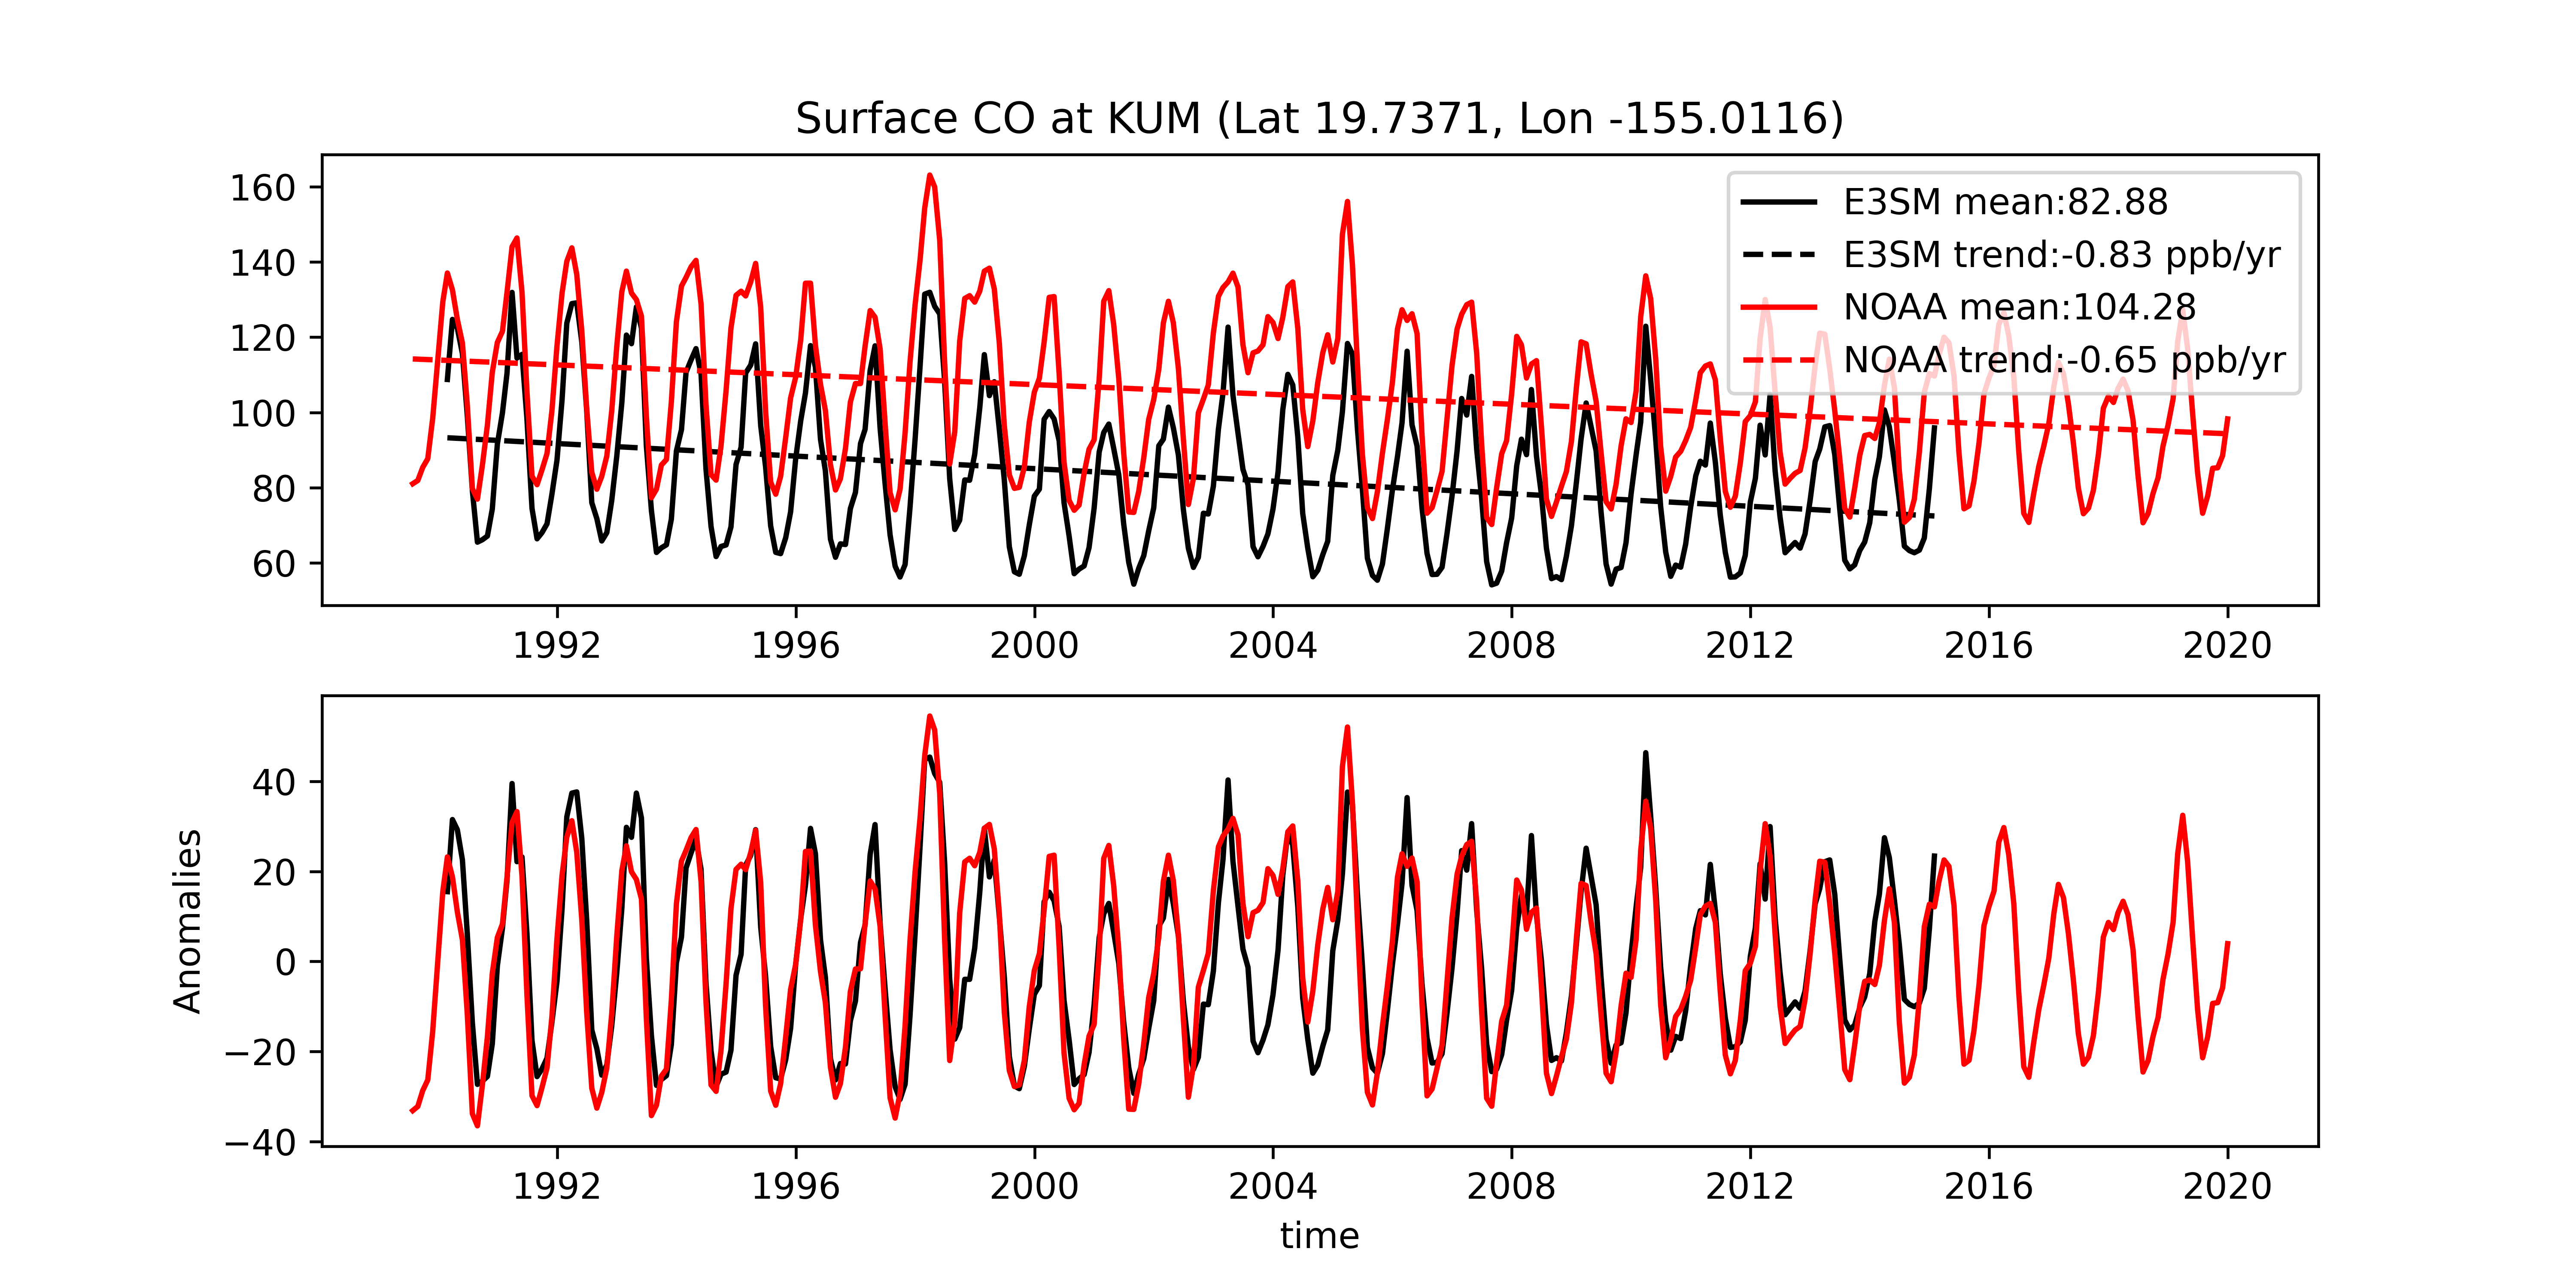
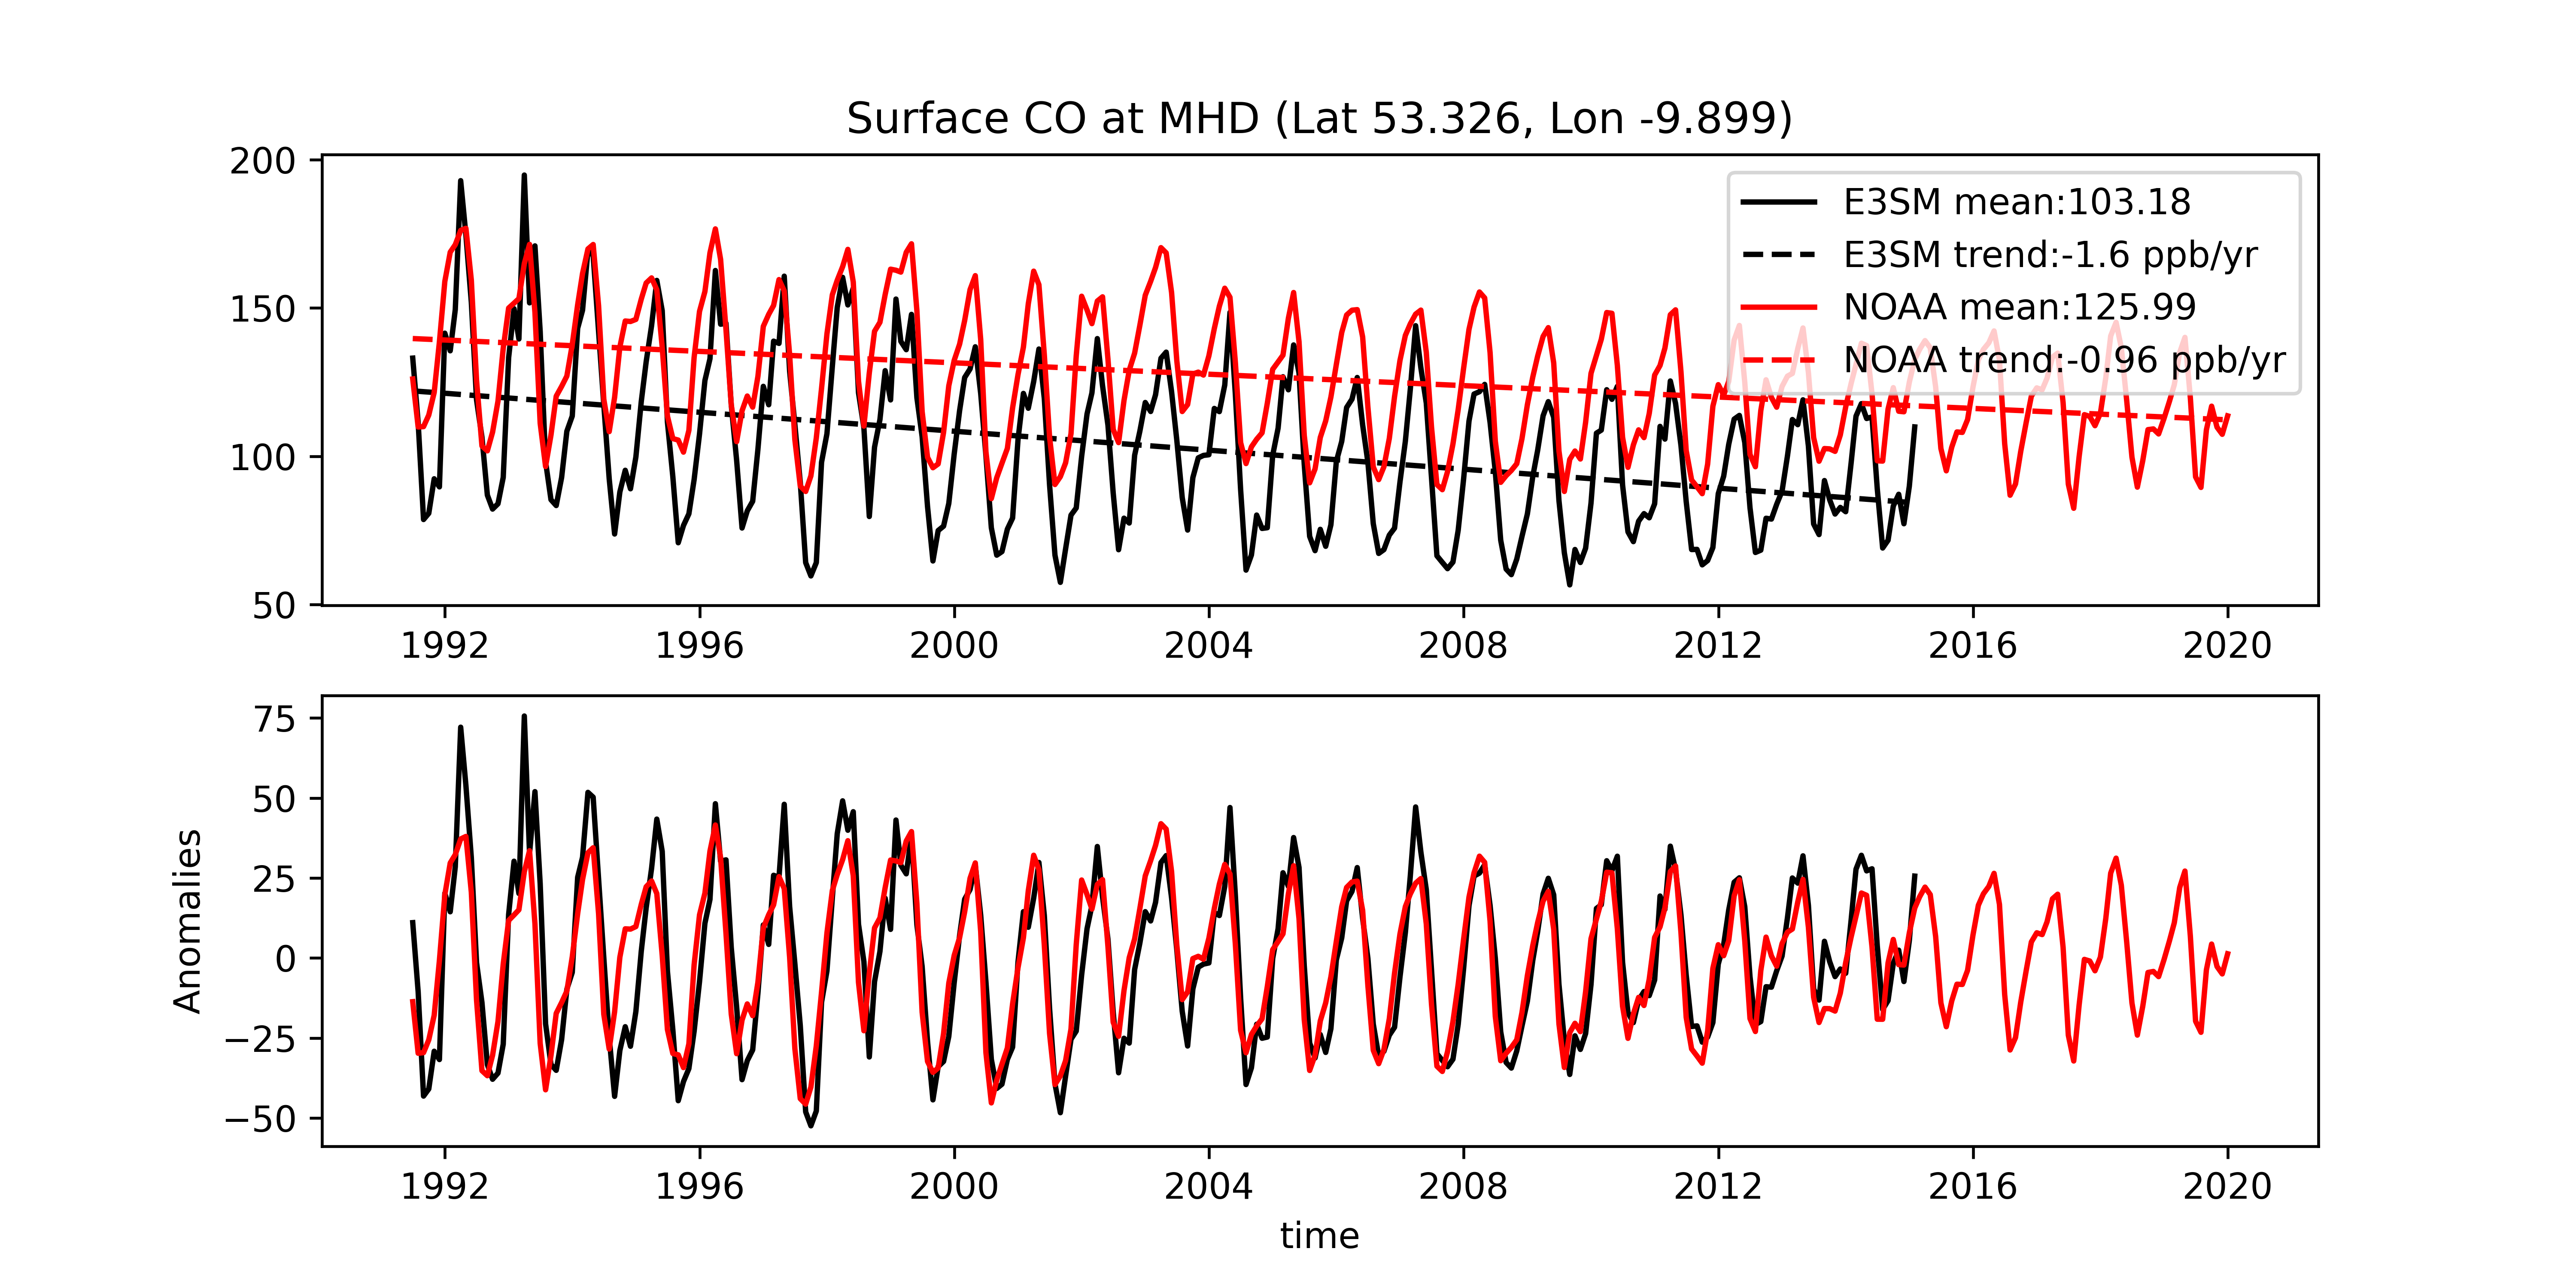
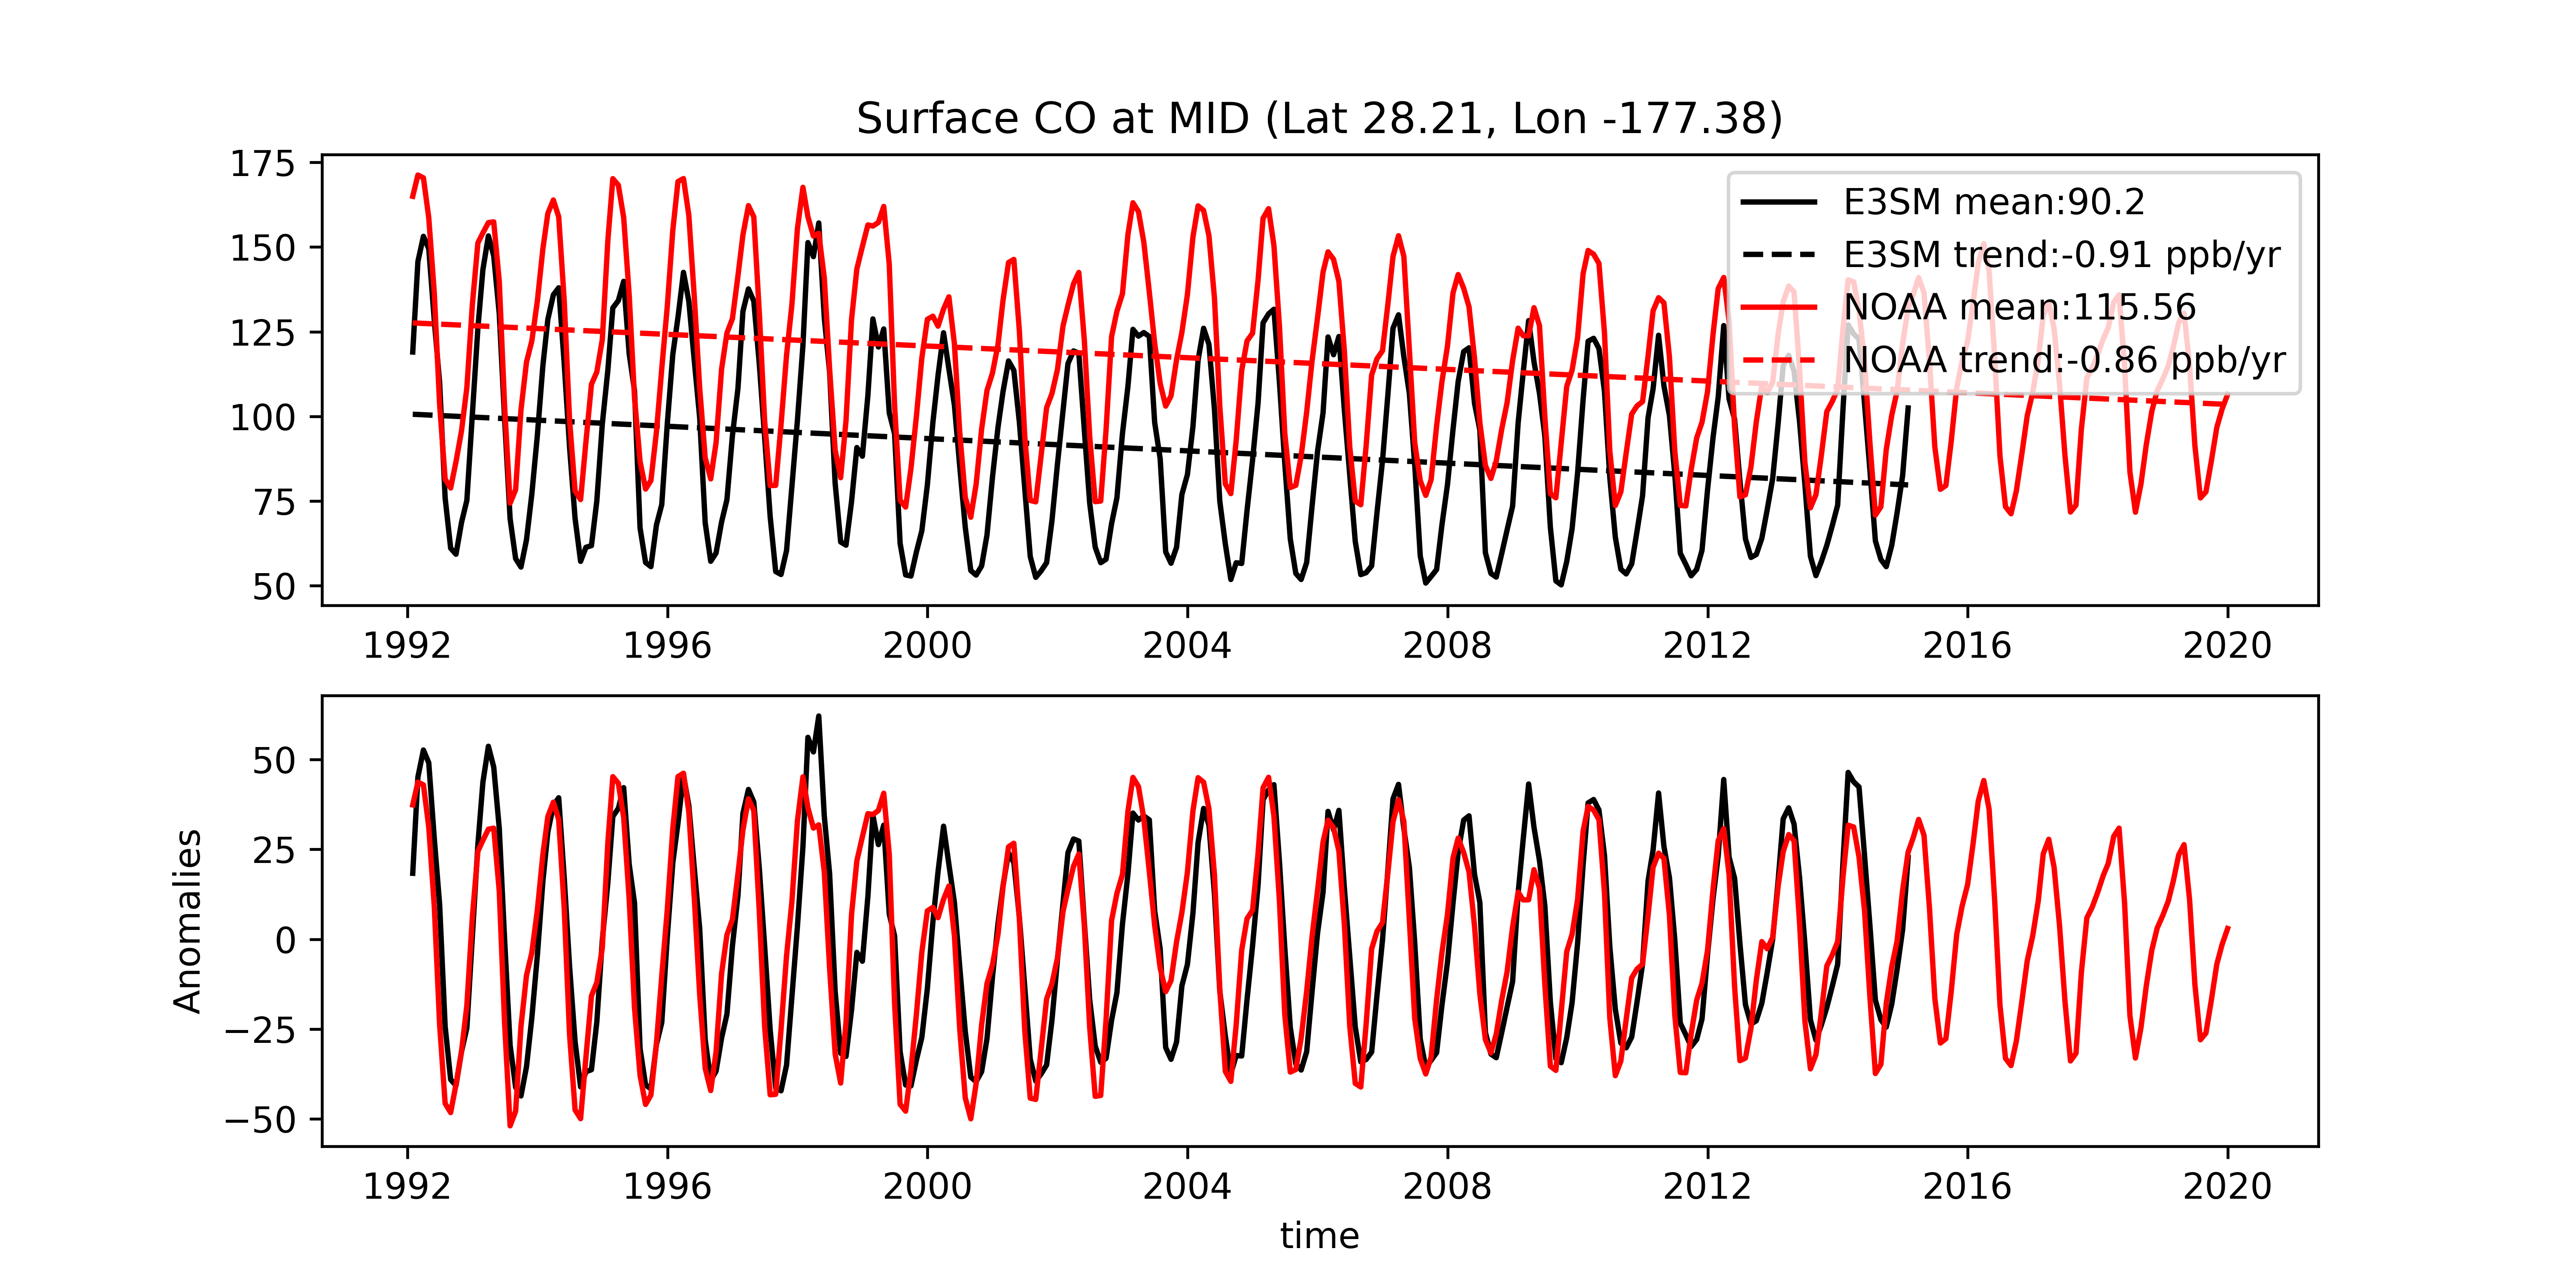
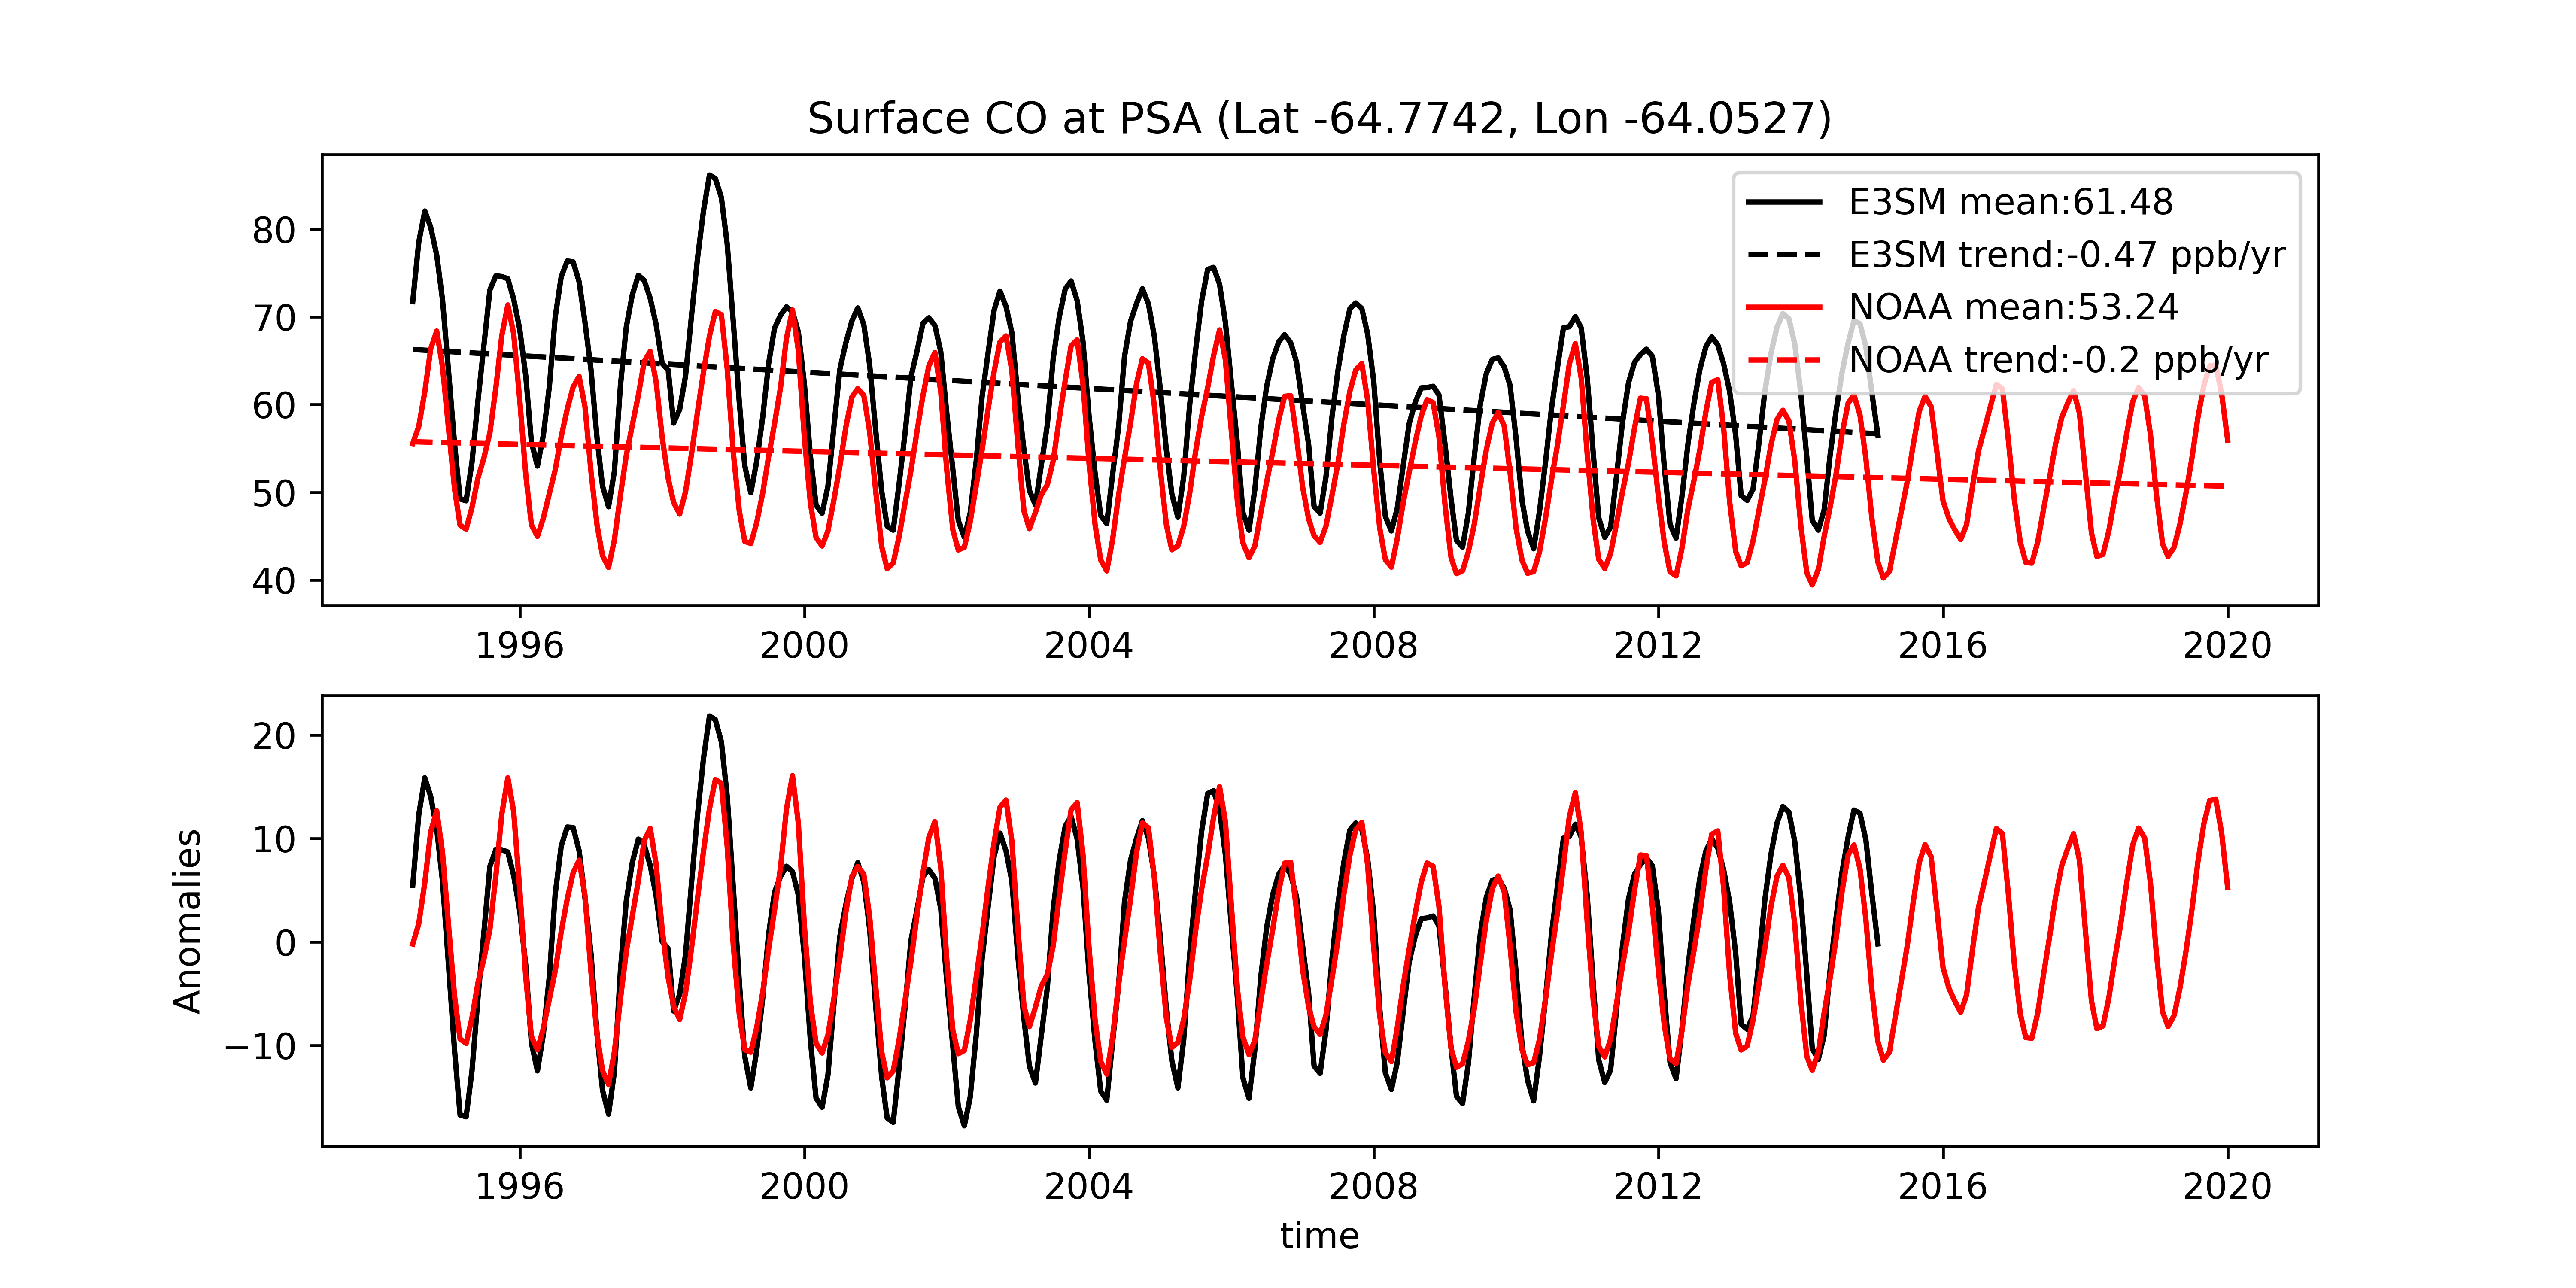
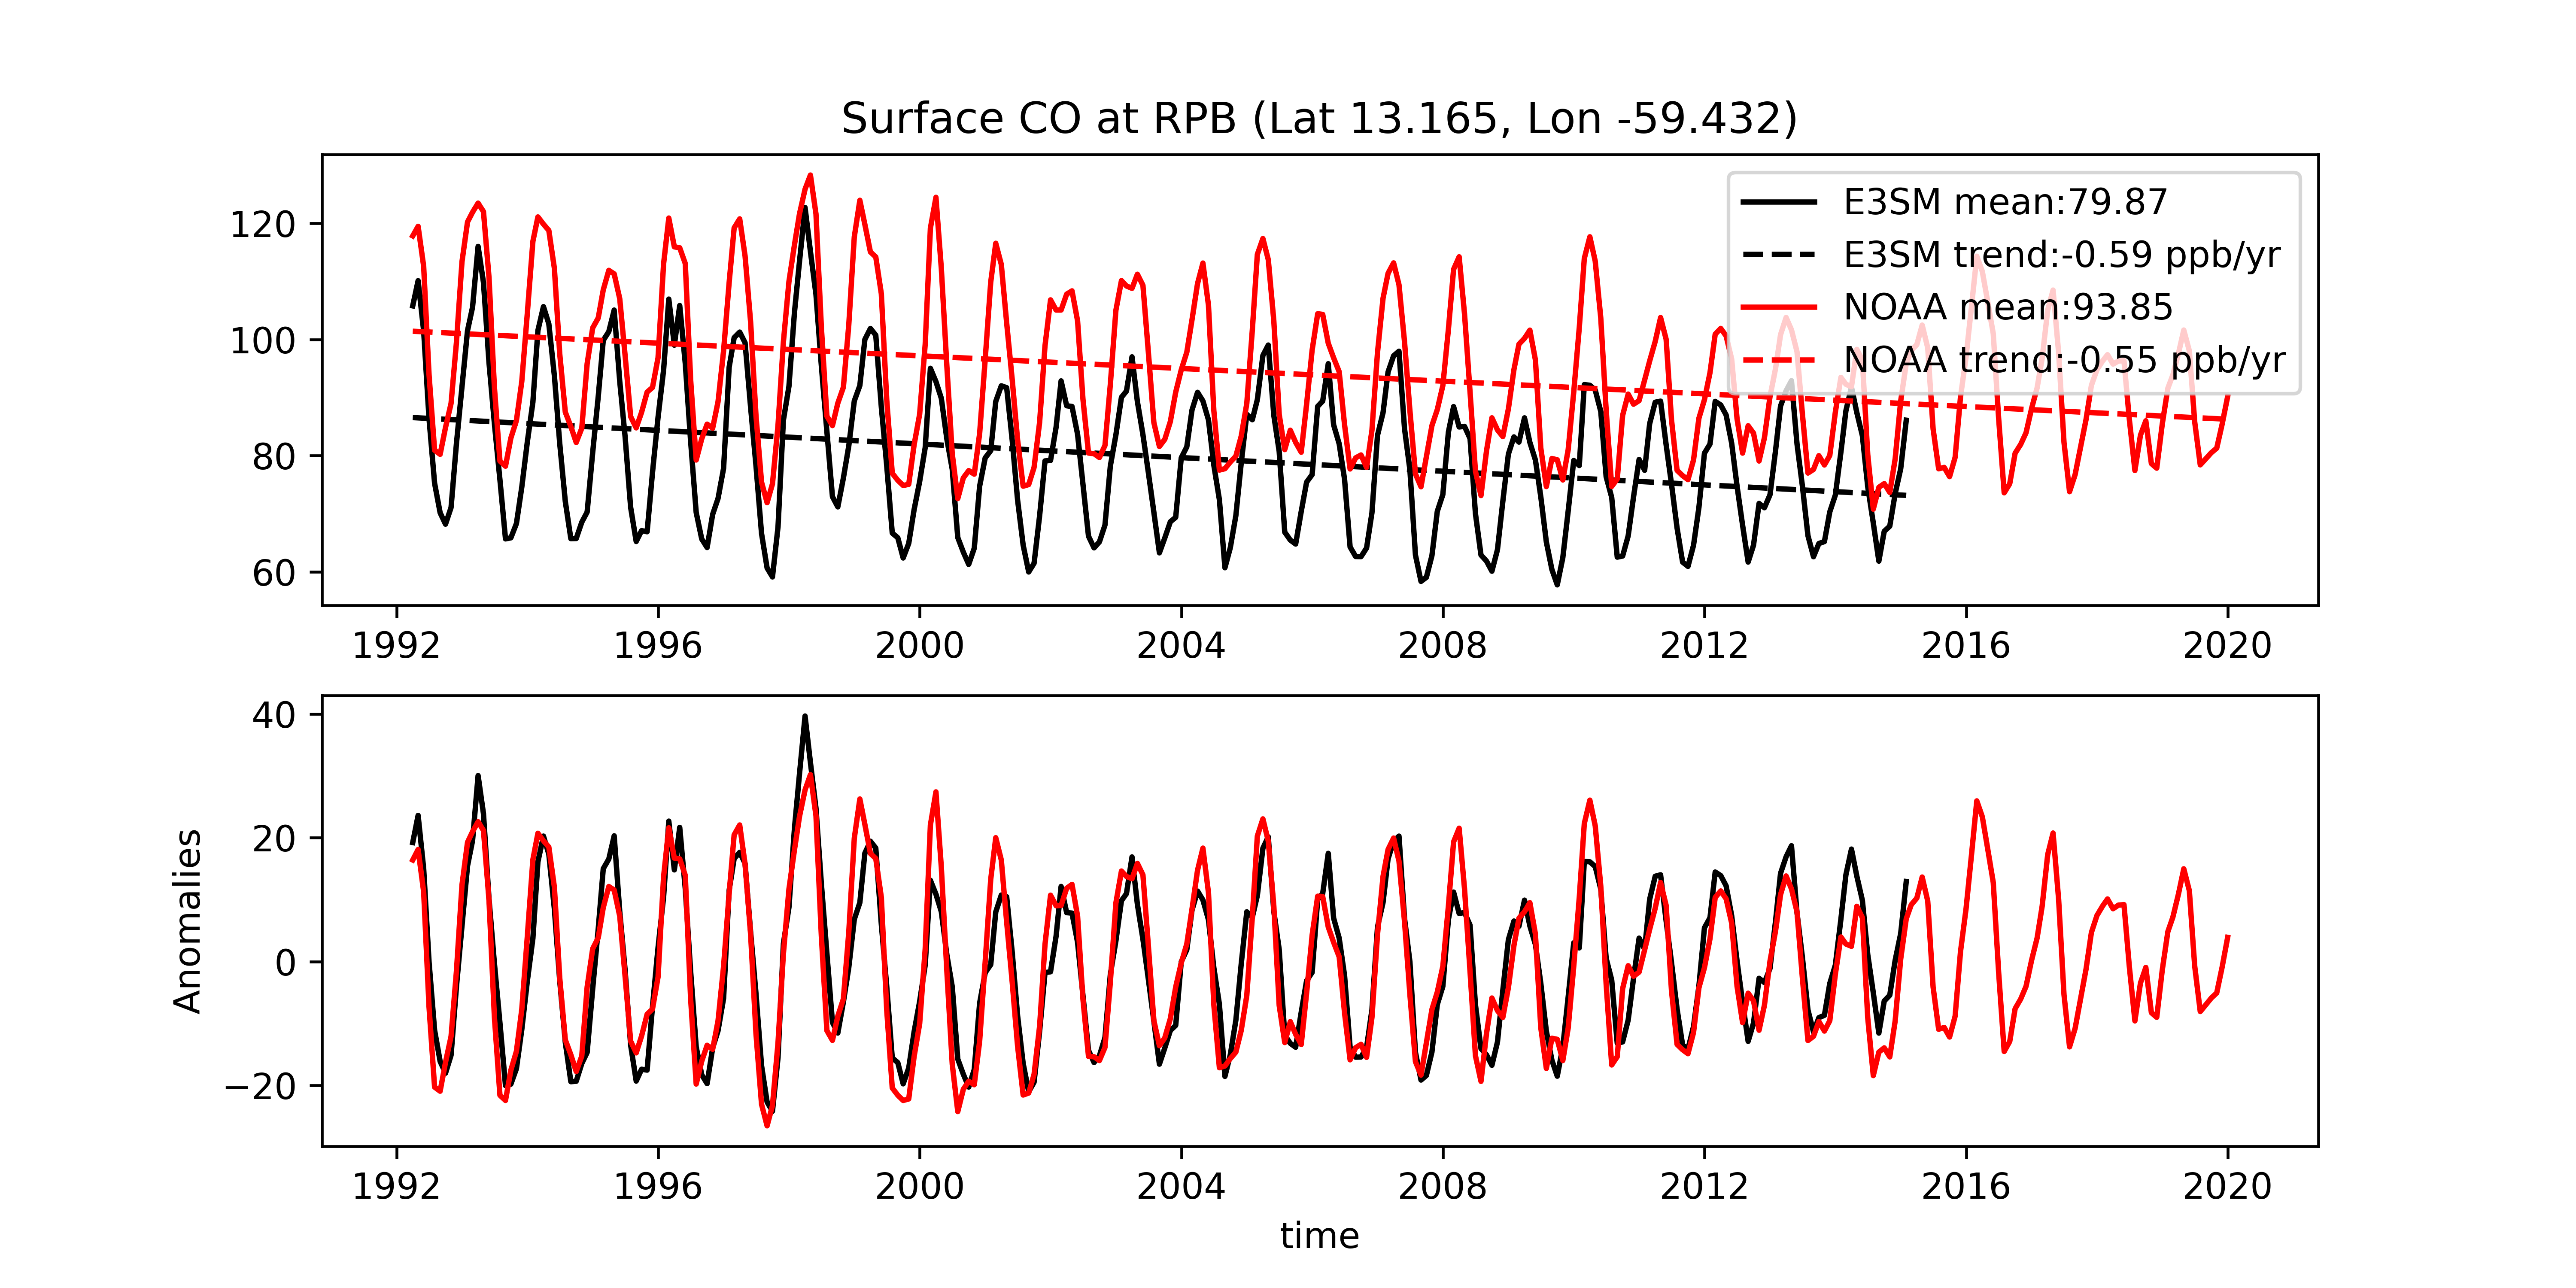
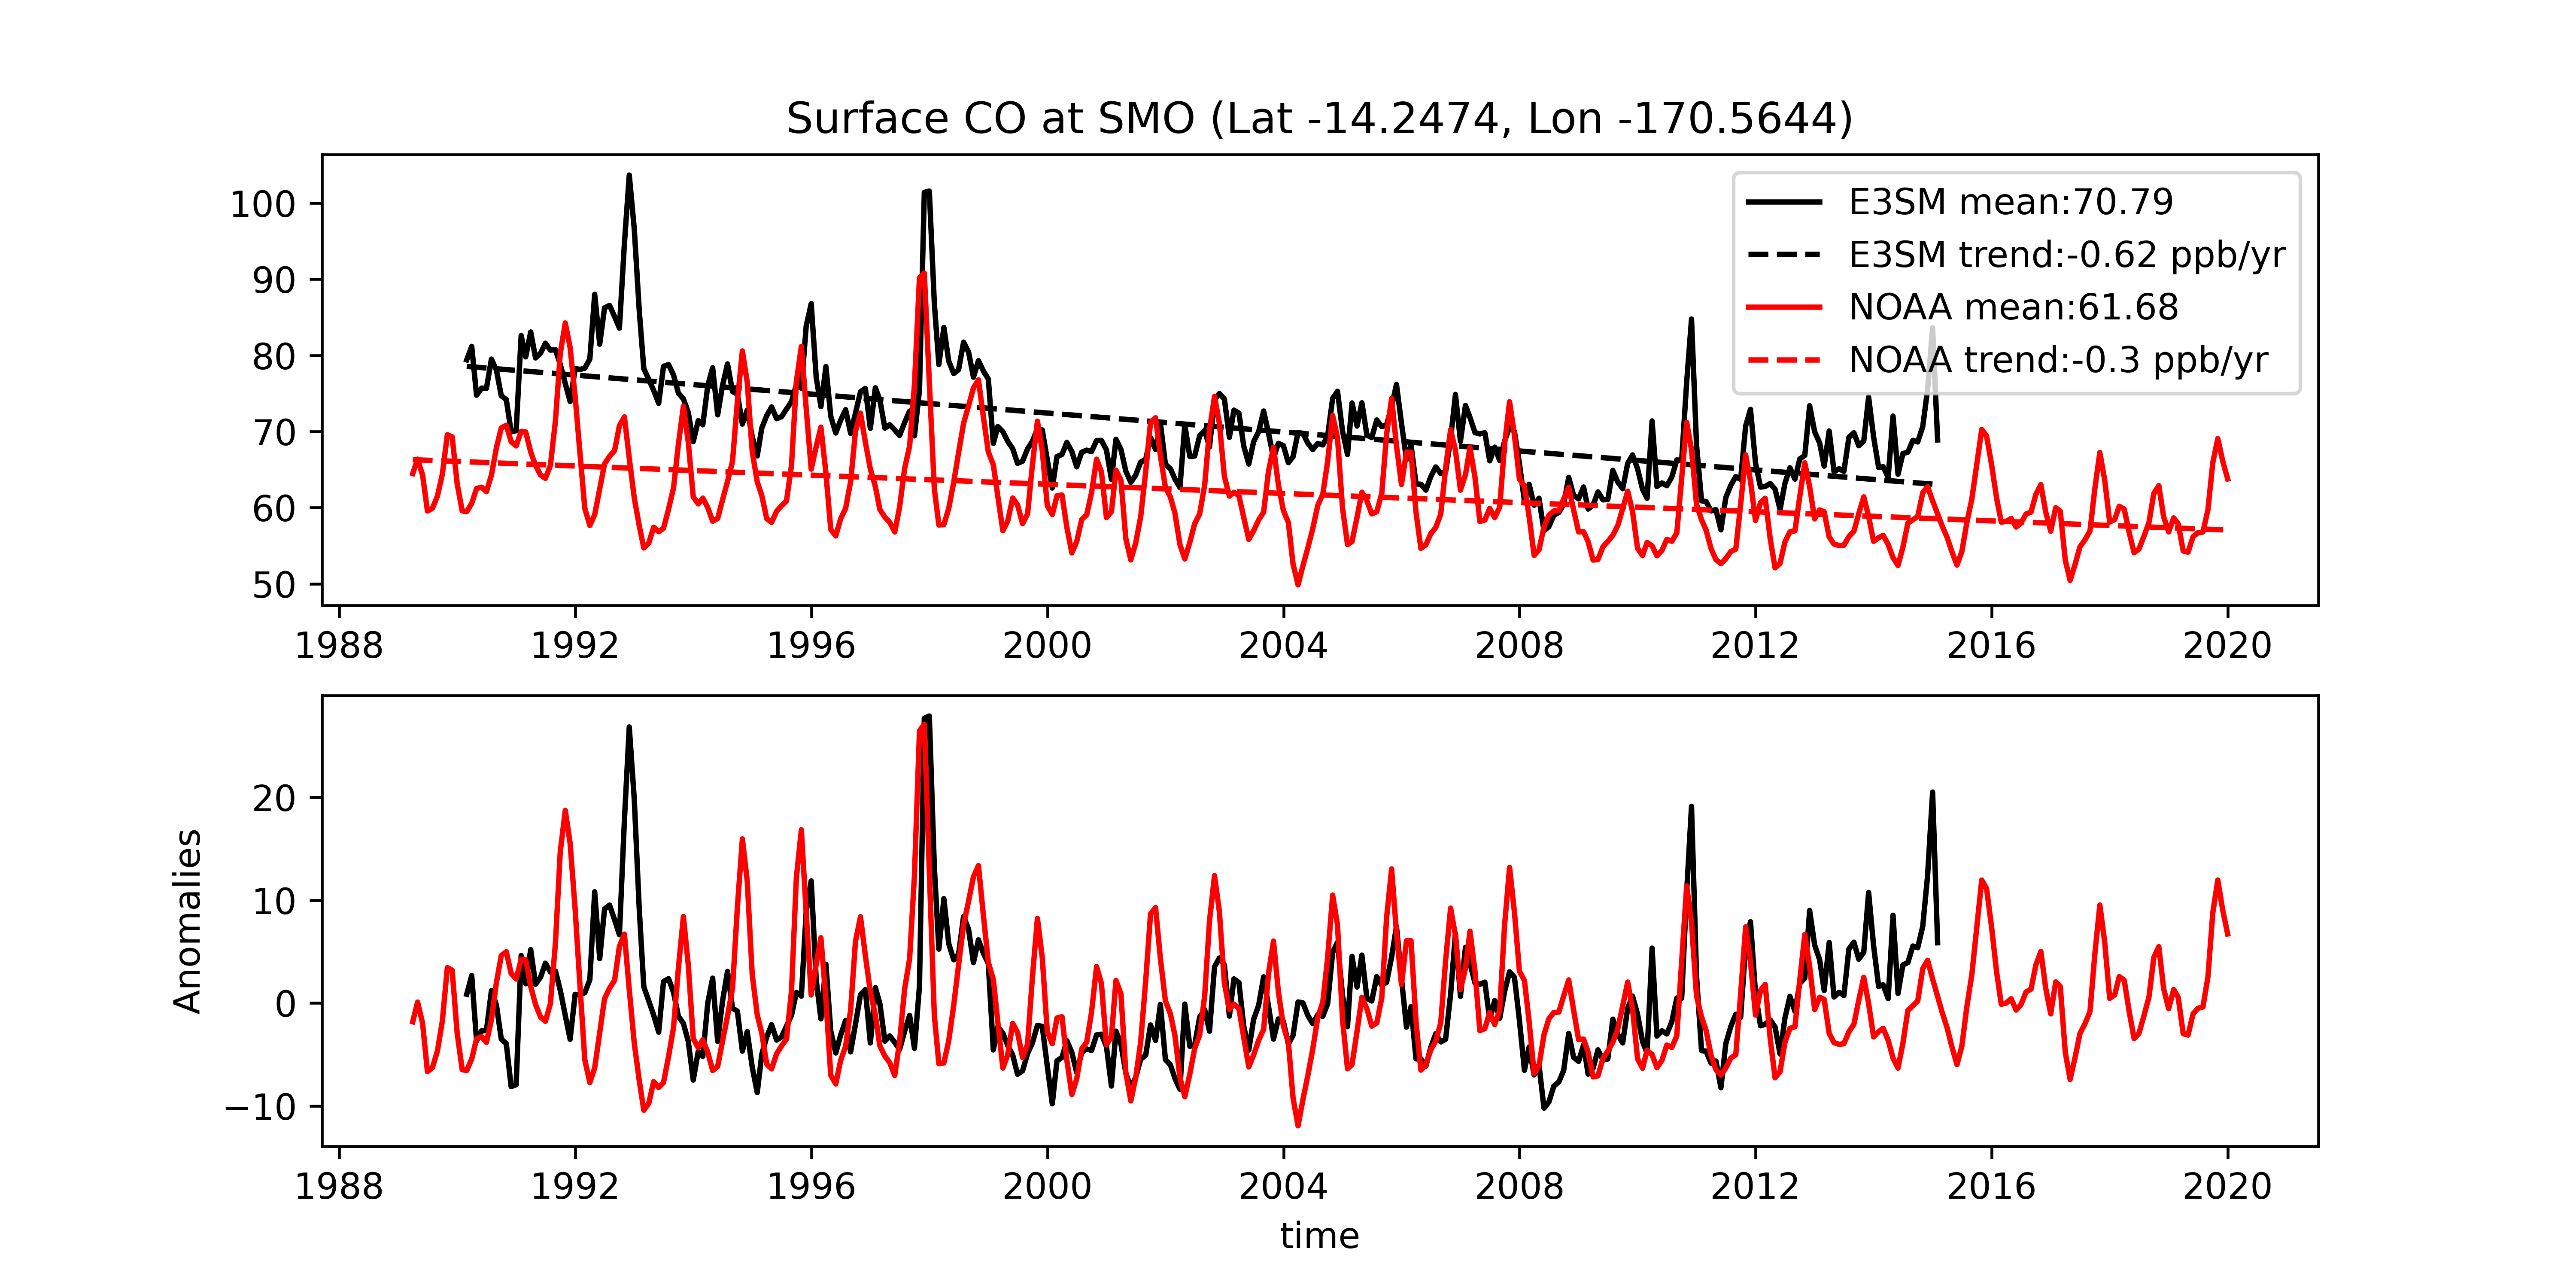
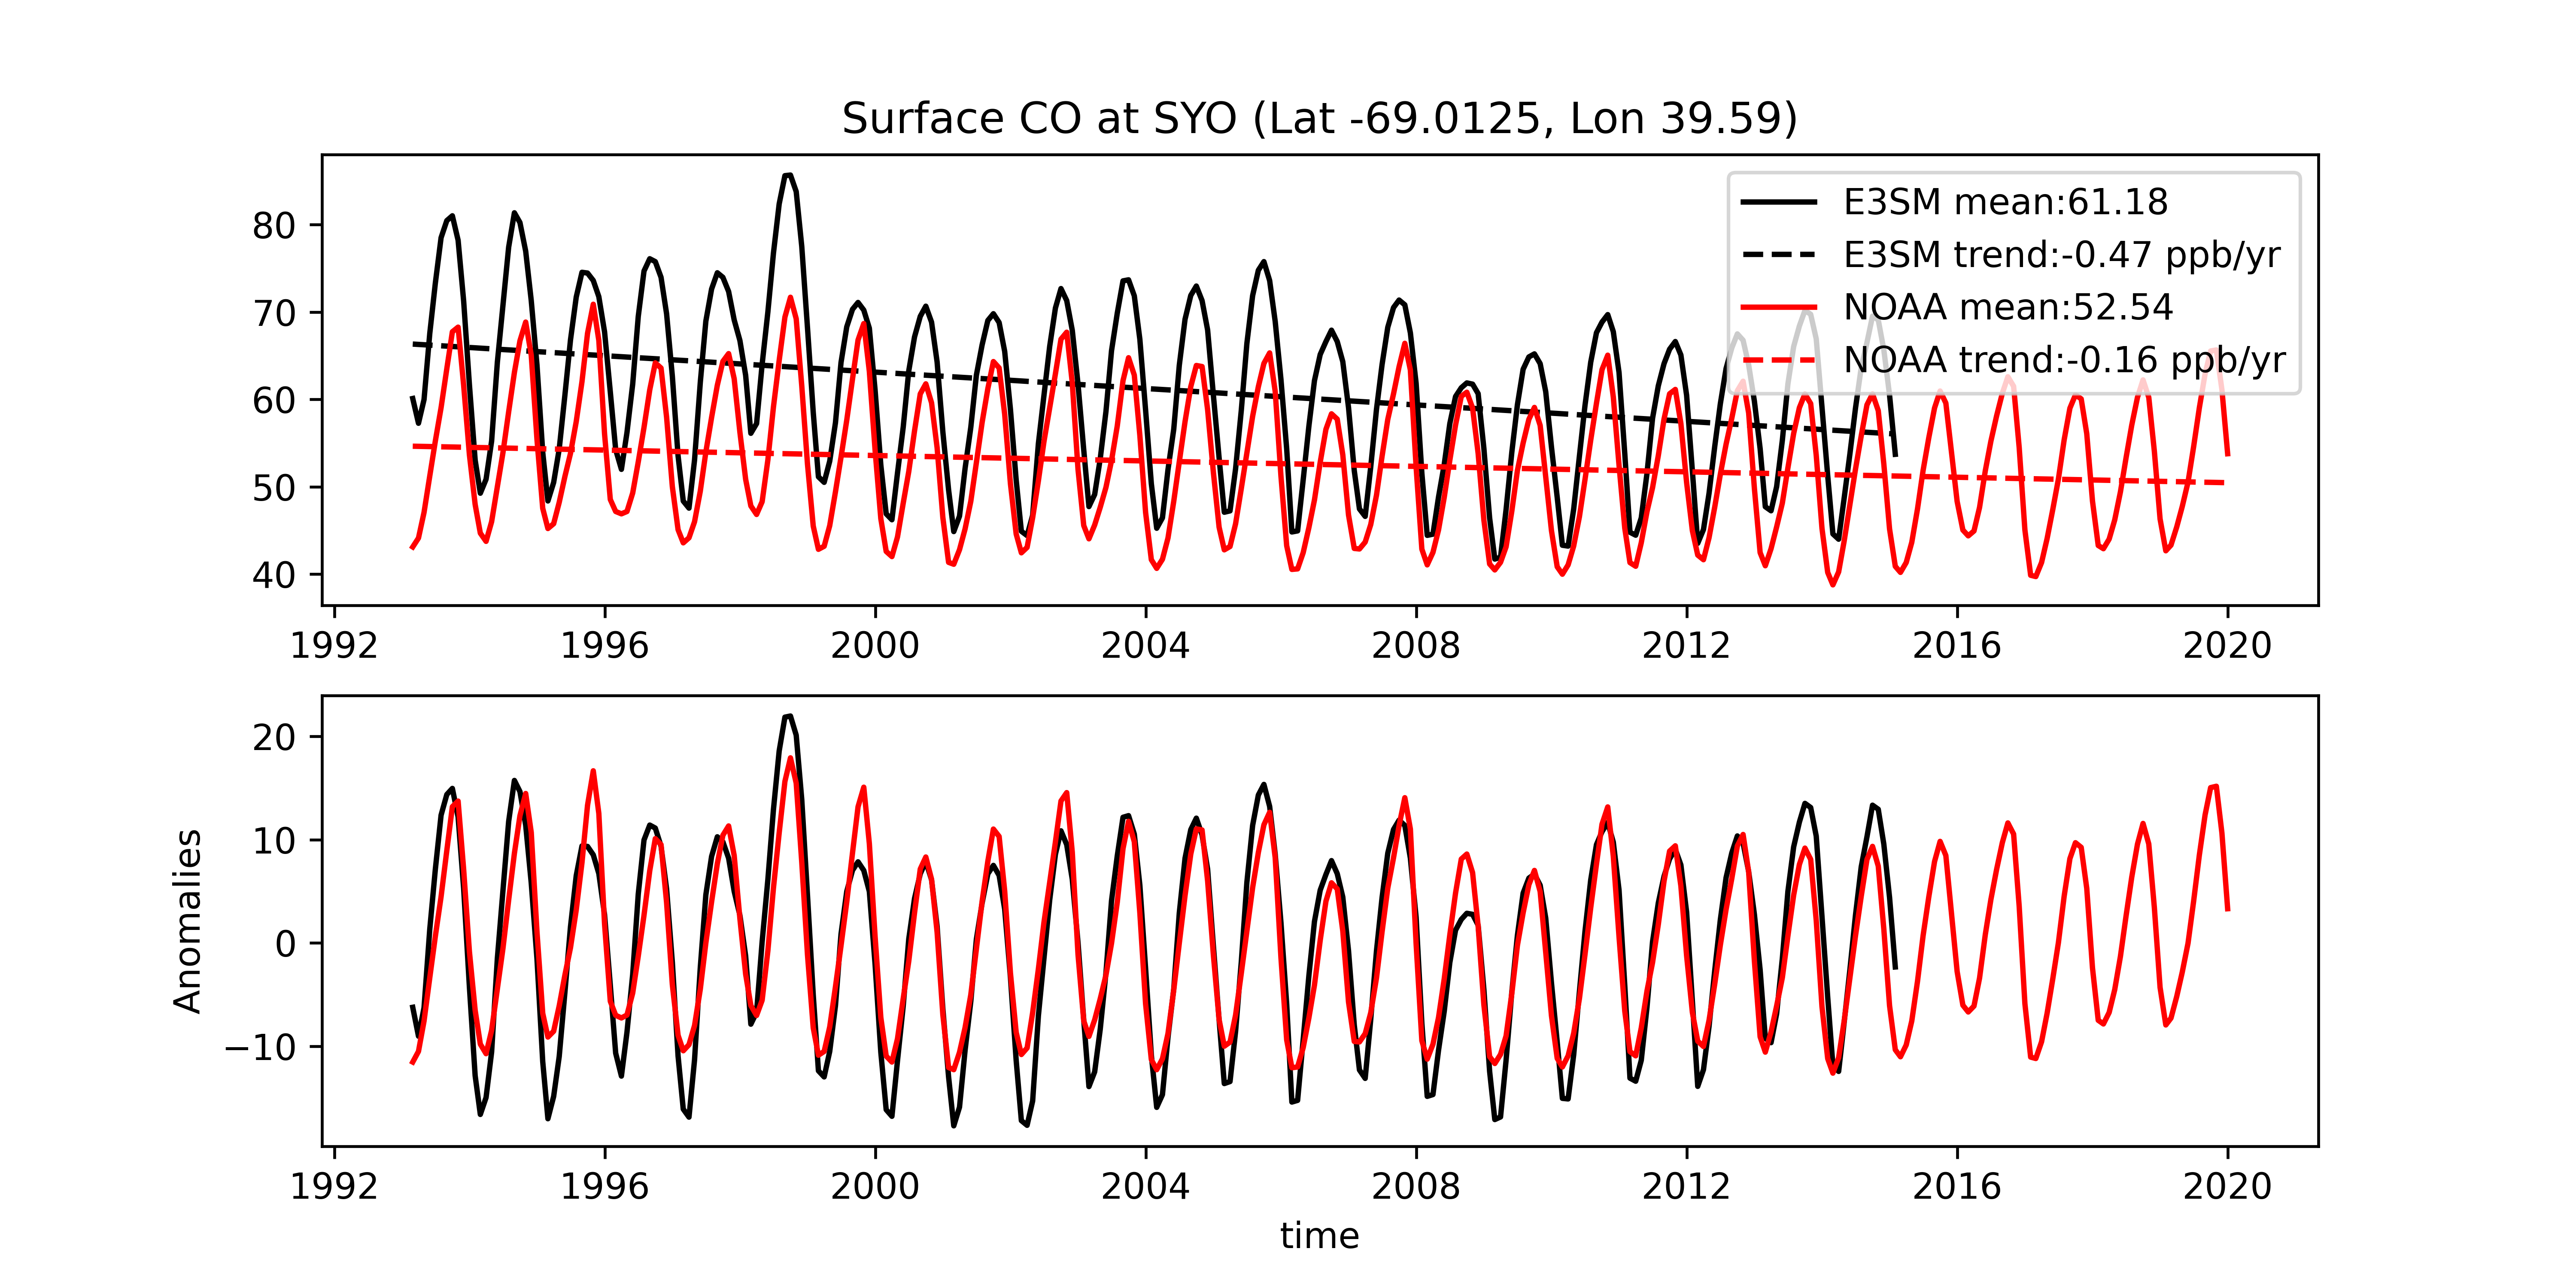
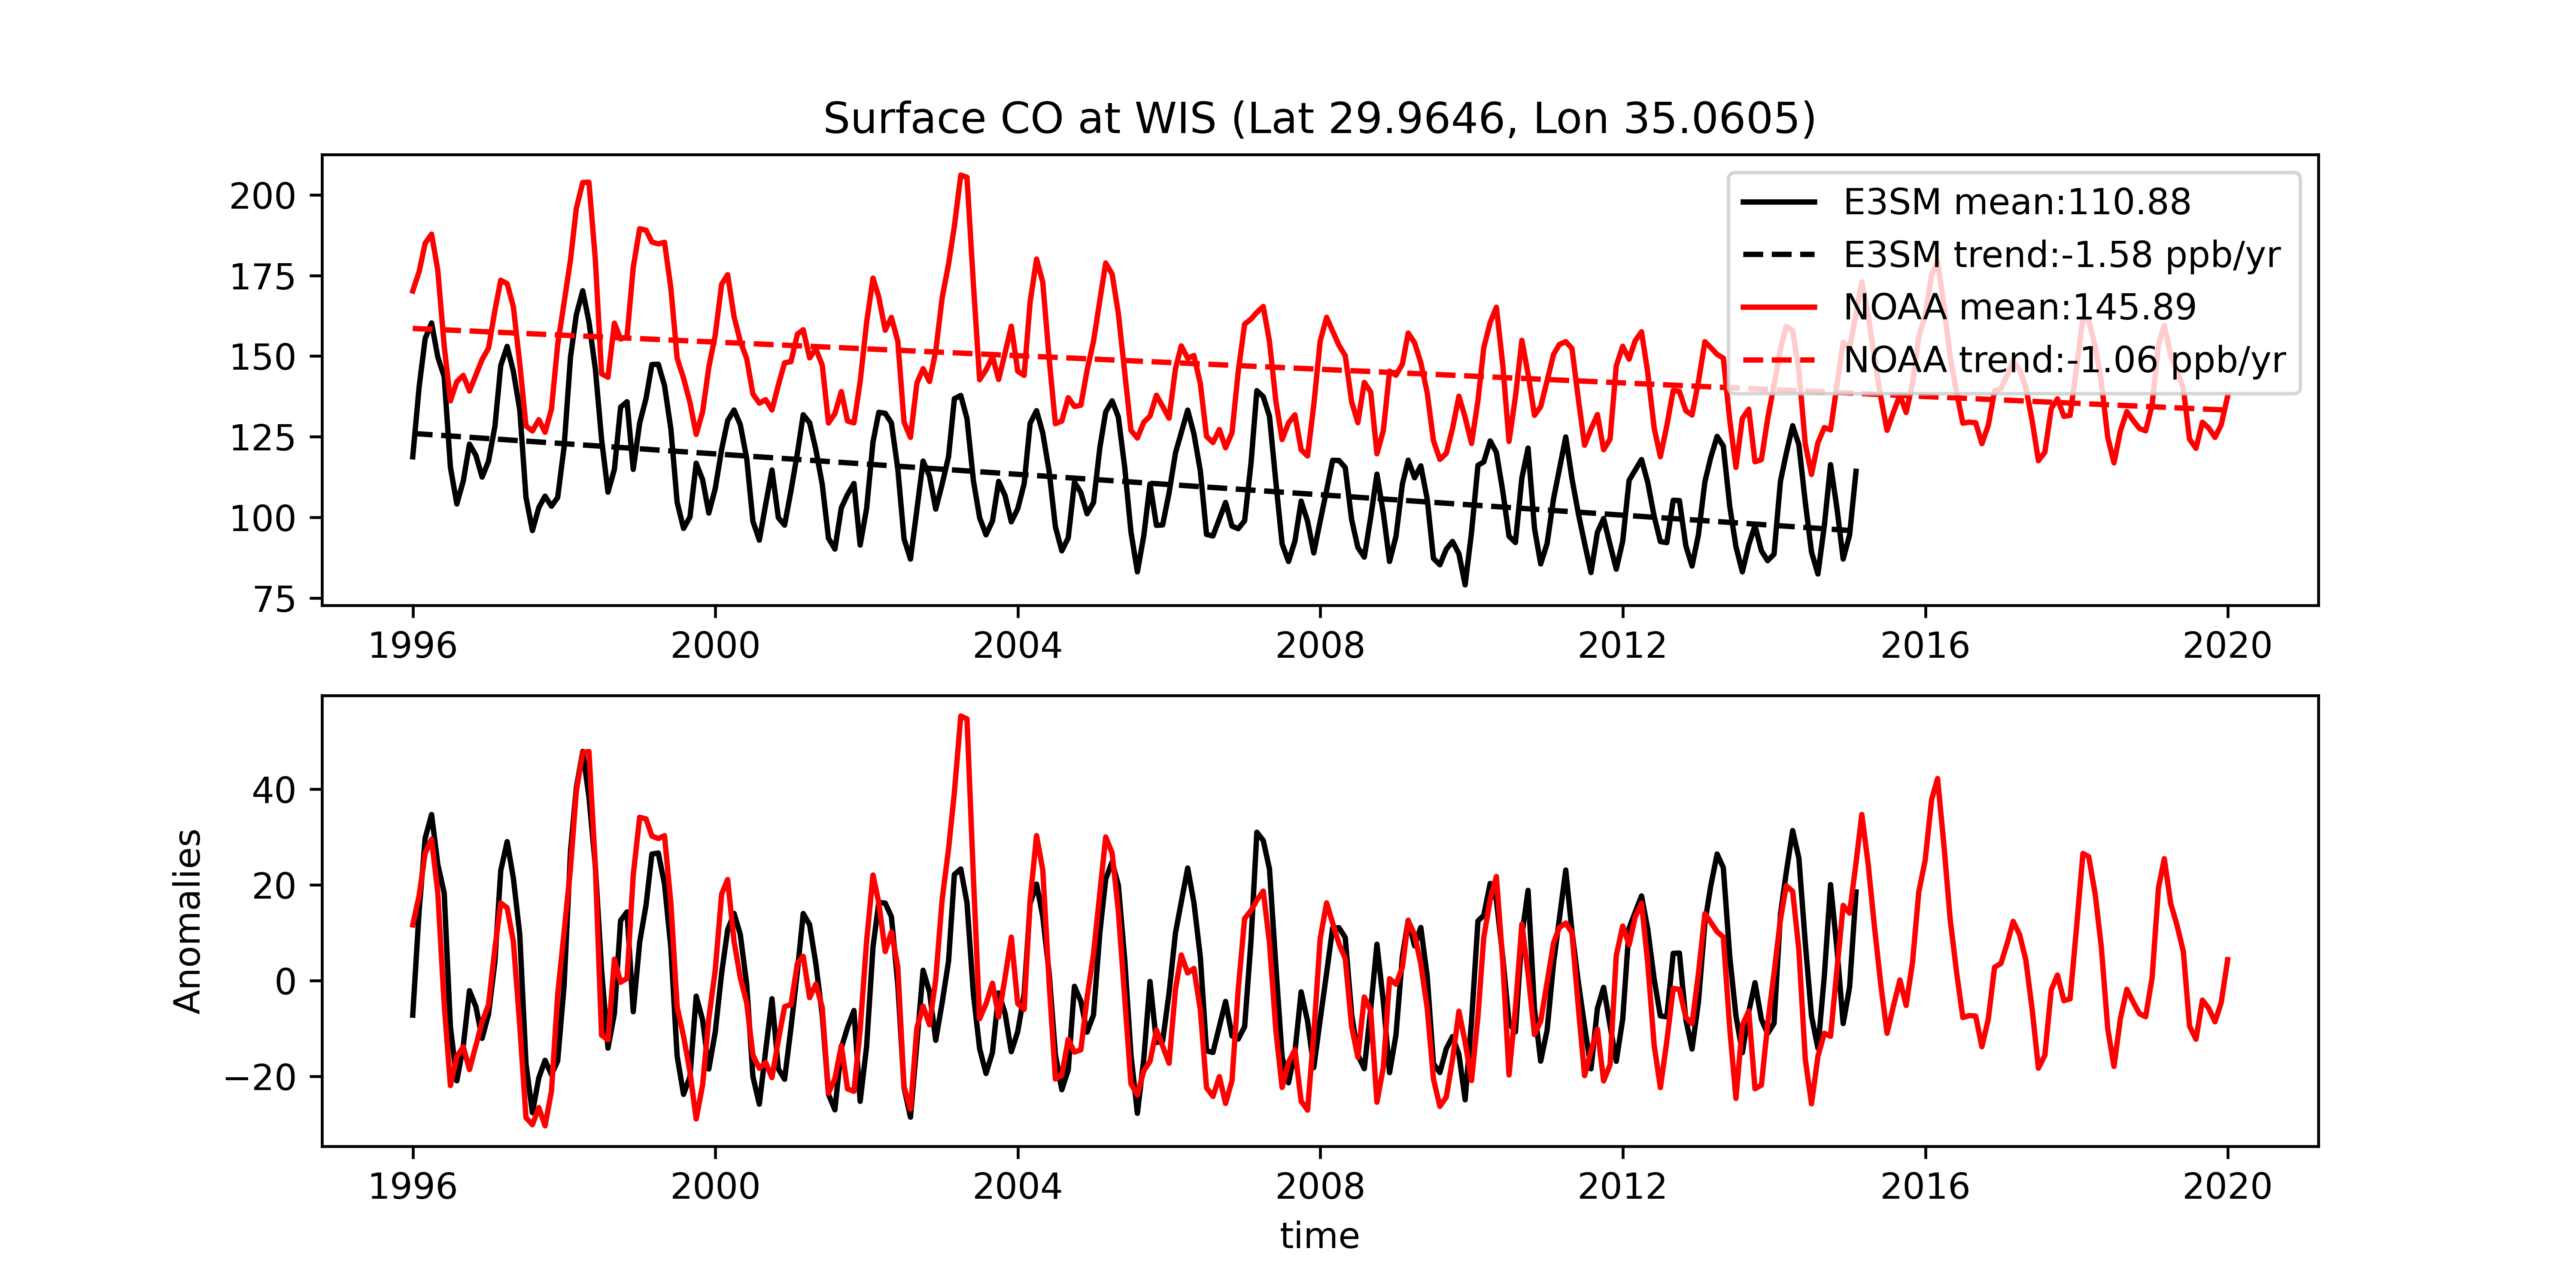
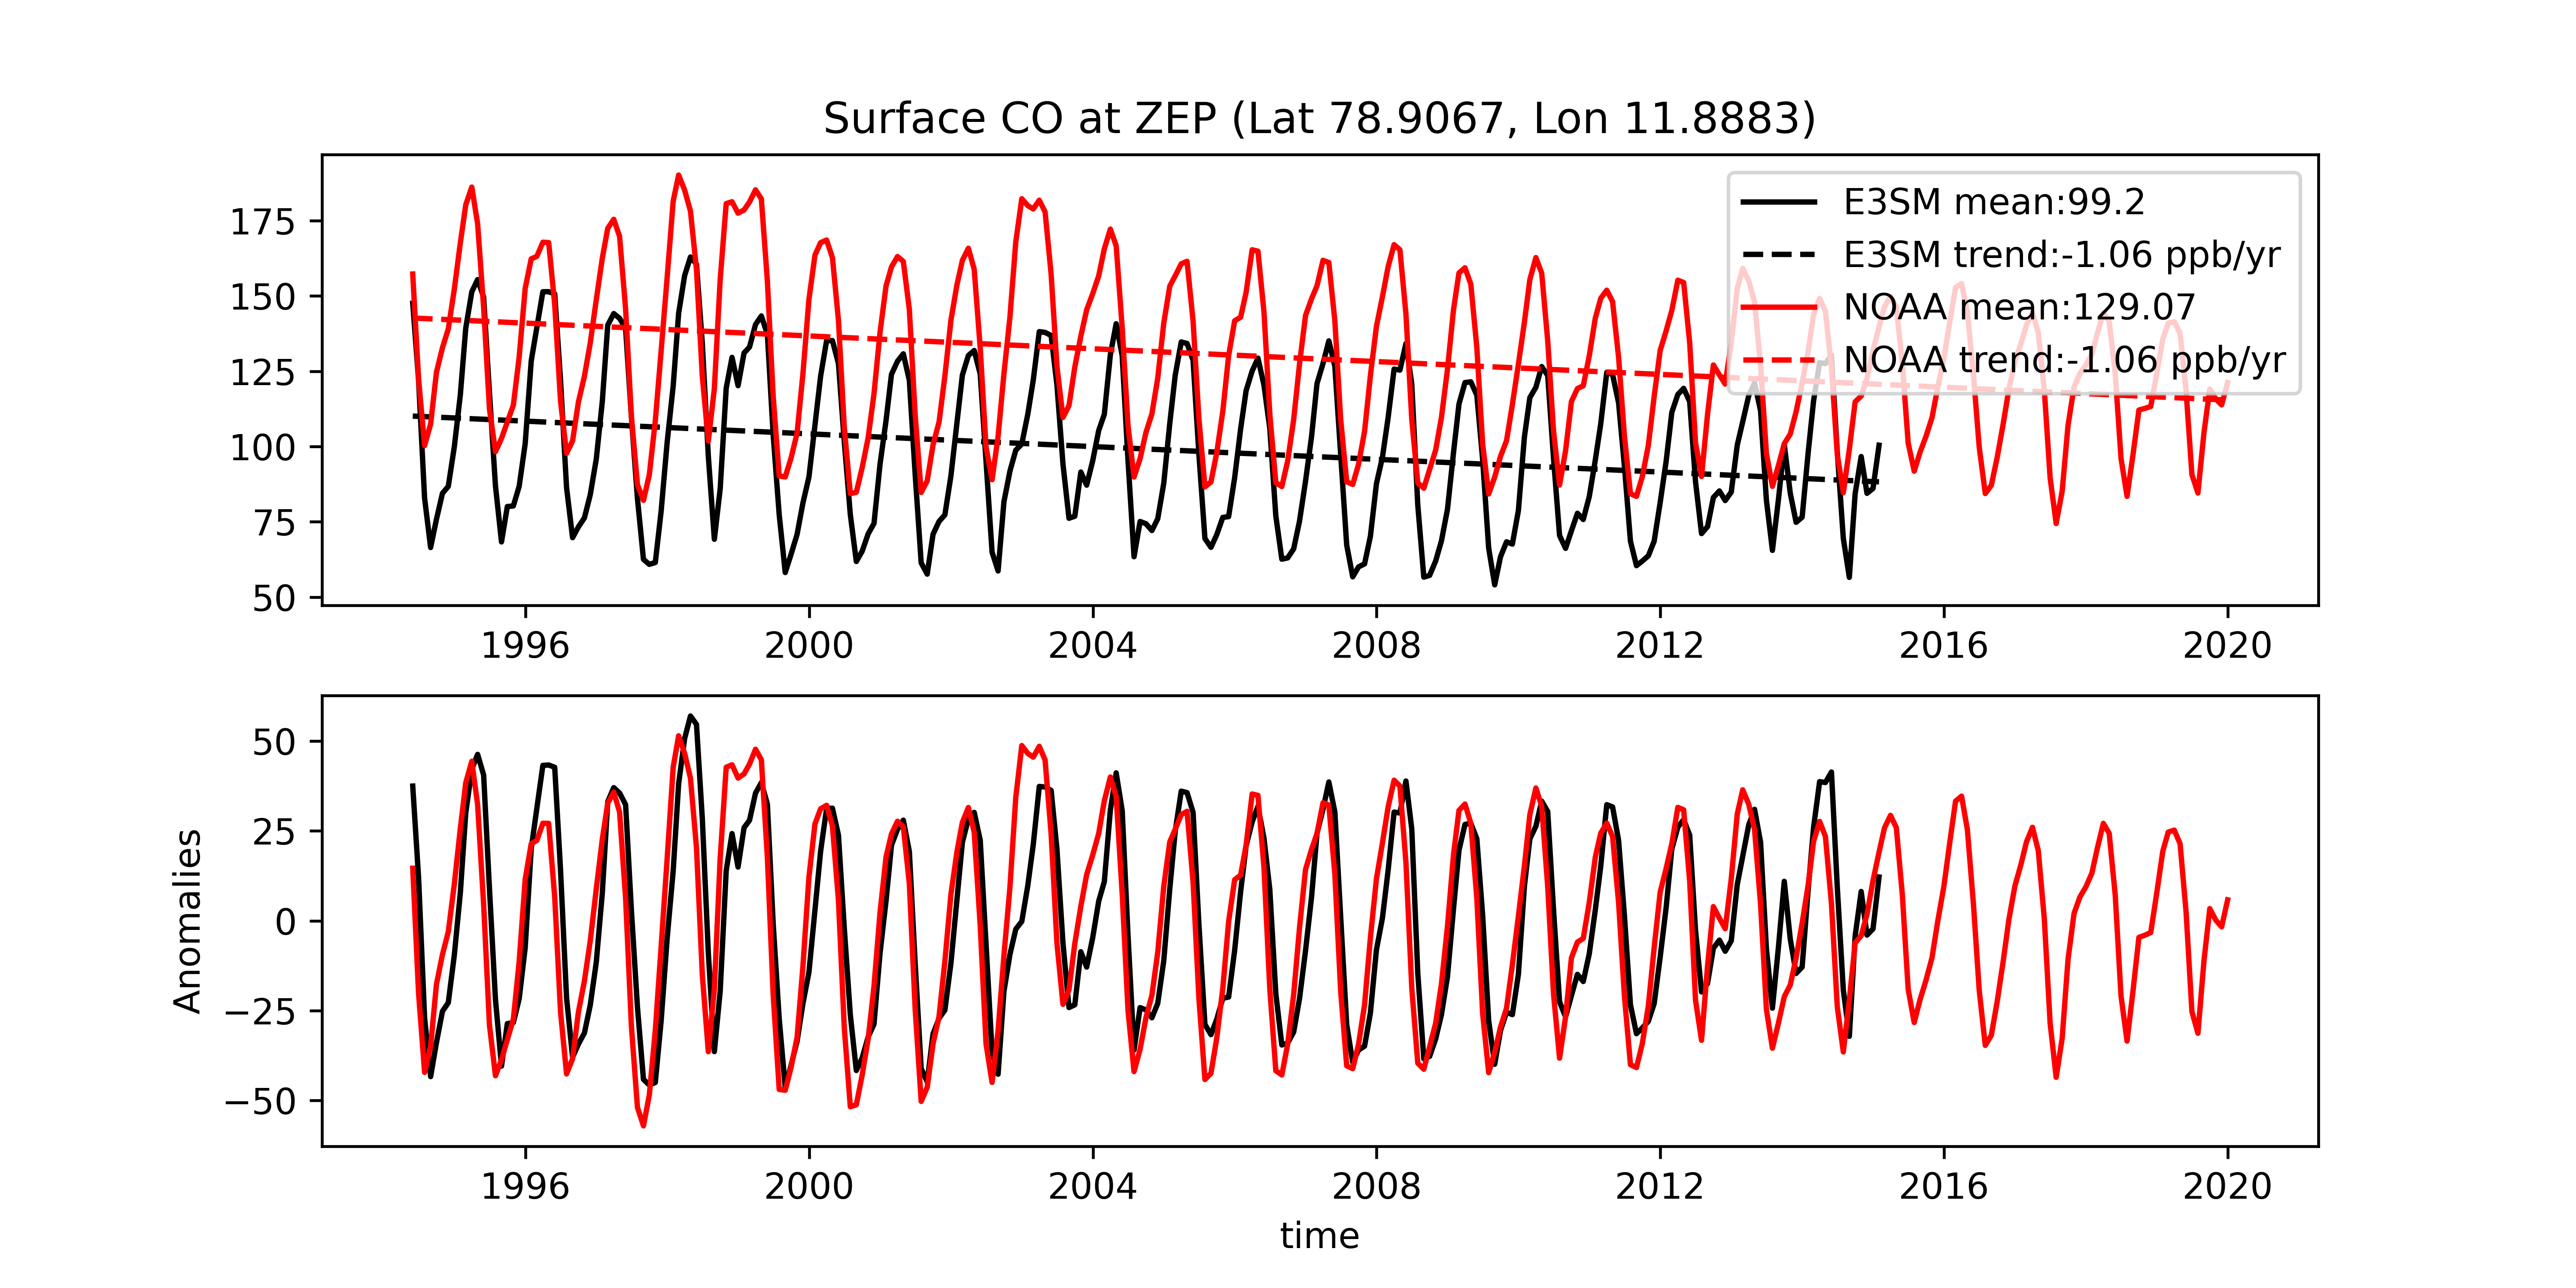
Surface CO comparison with NOAA observations BRW CGO ICE KUM MHD MID PSA RPB SMO SYO WIS ZEP
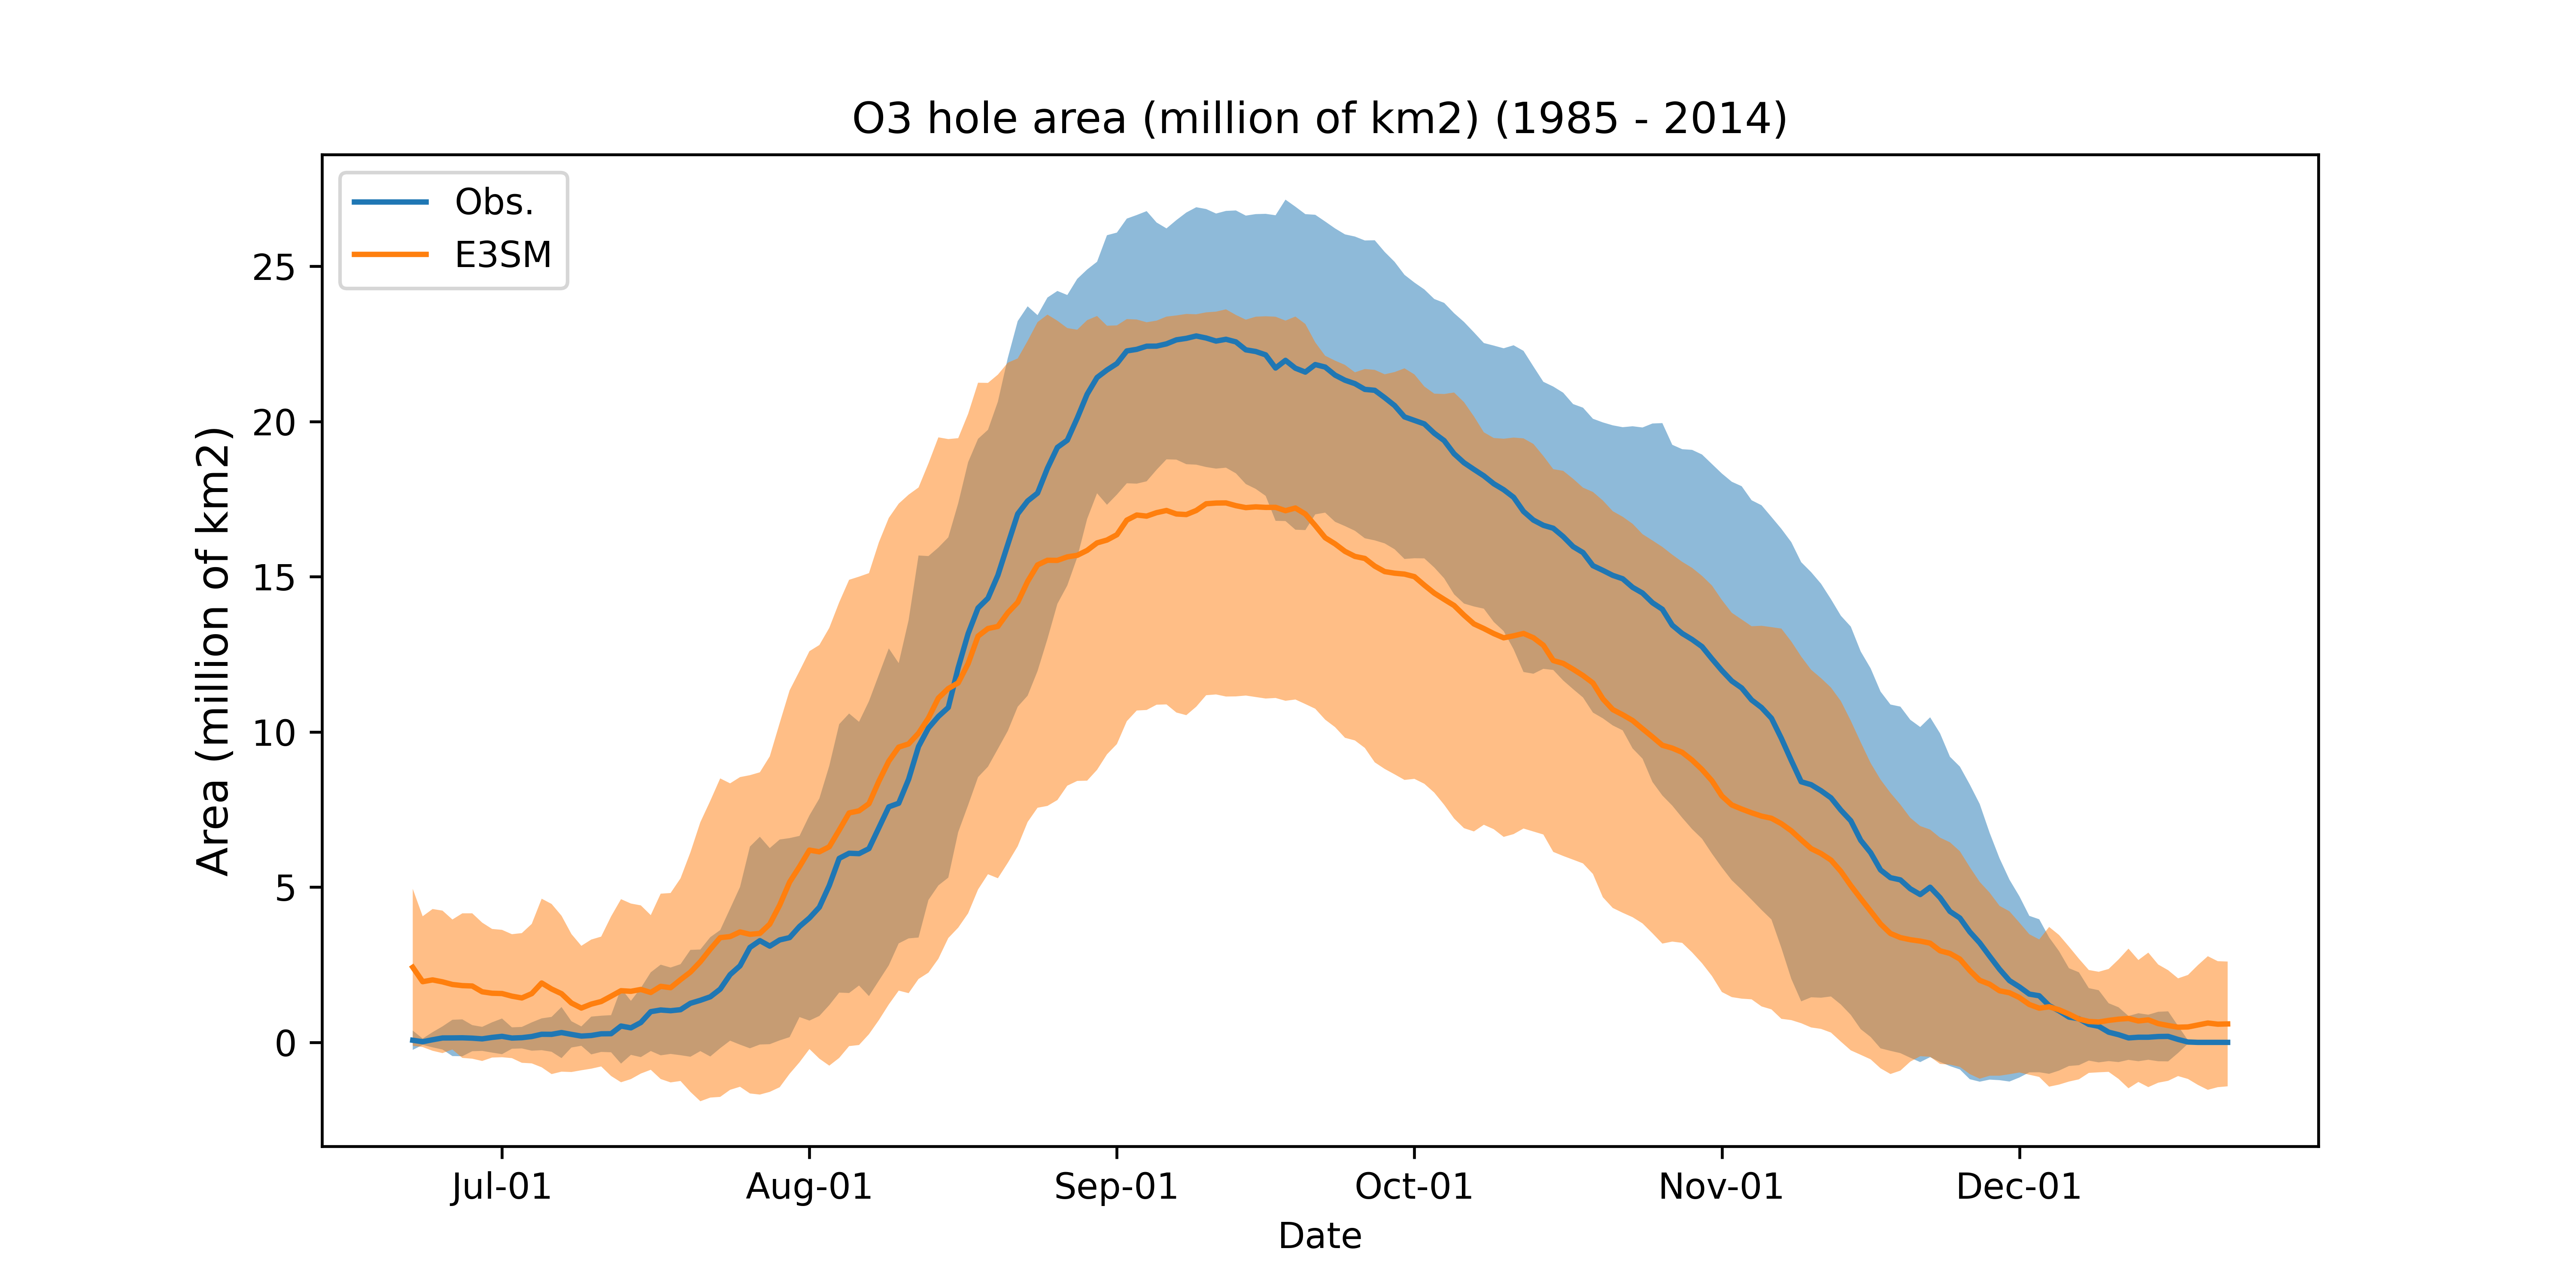
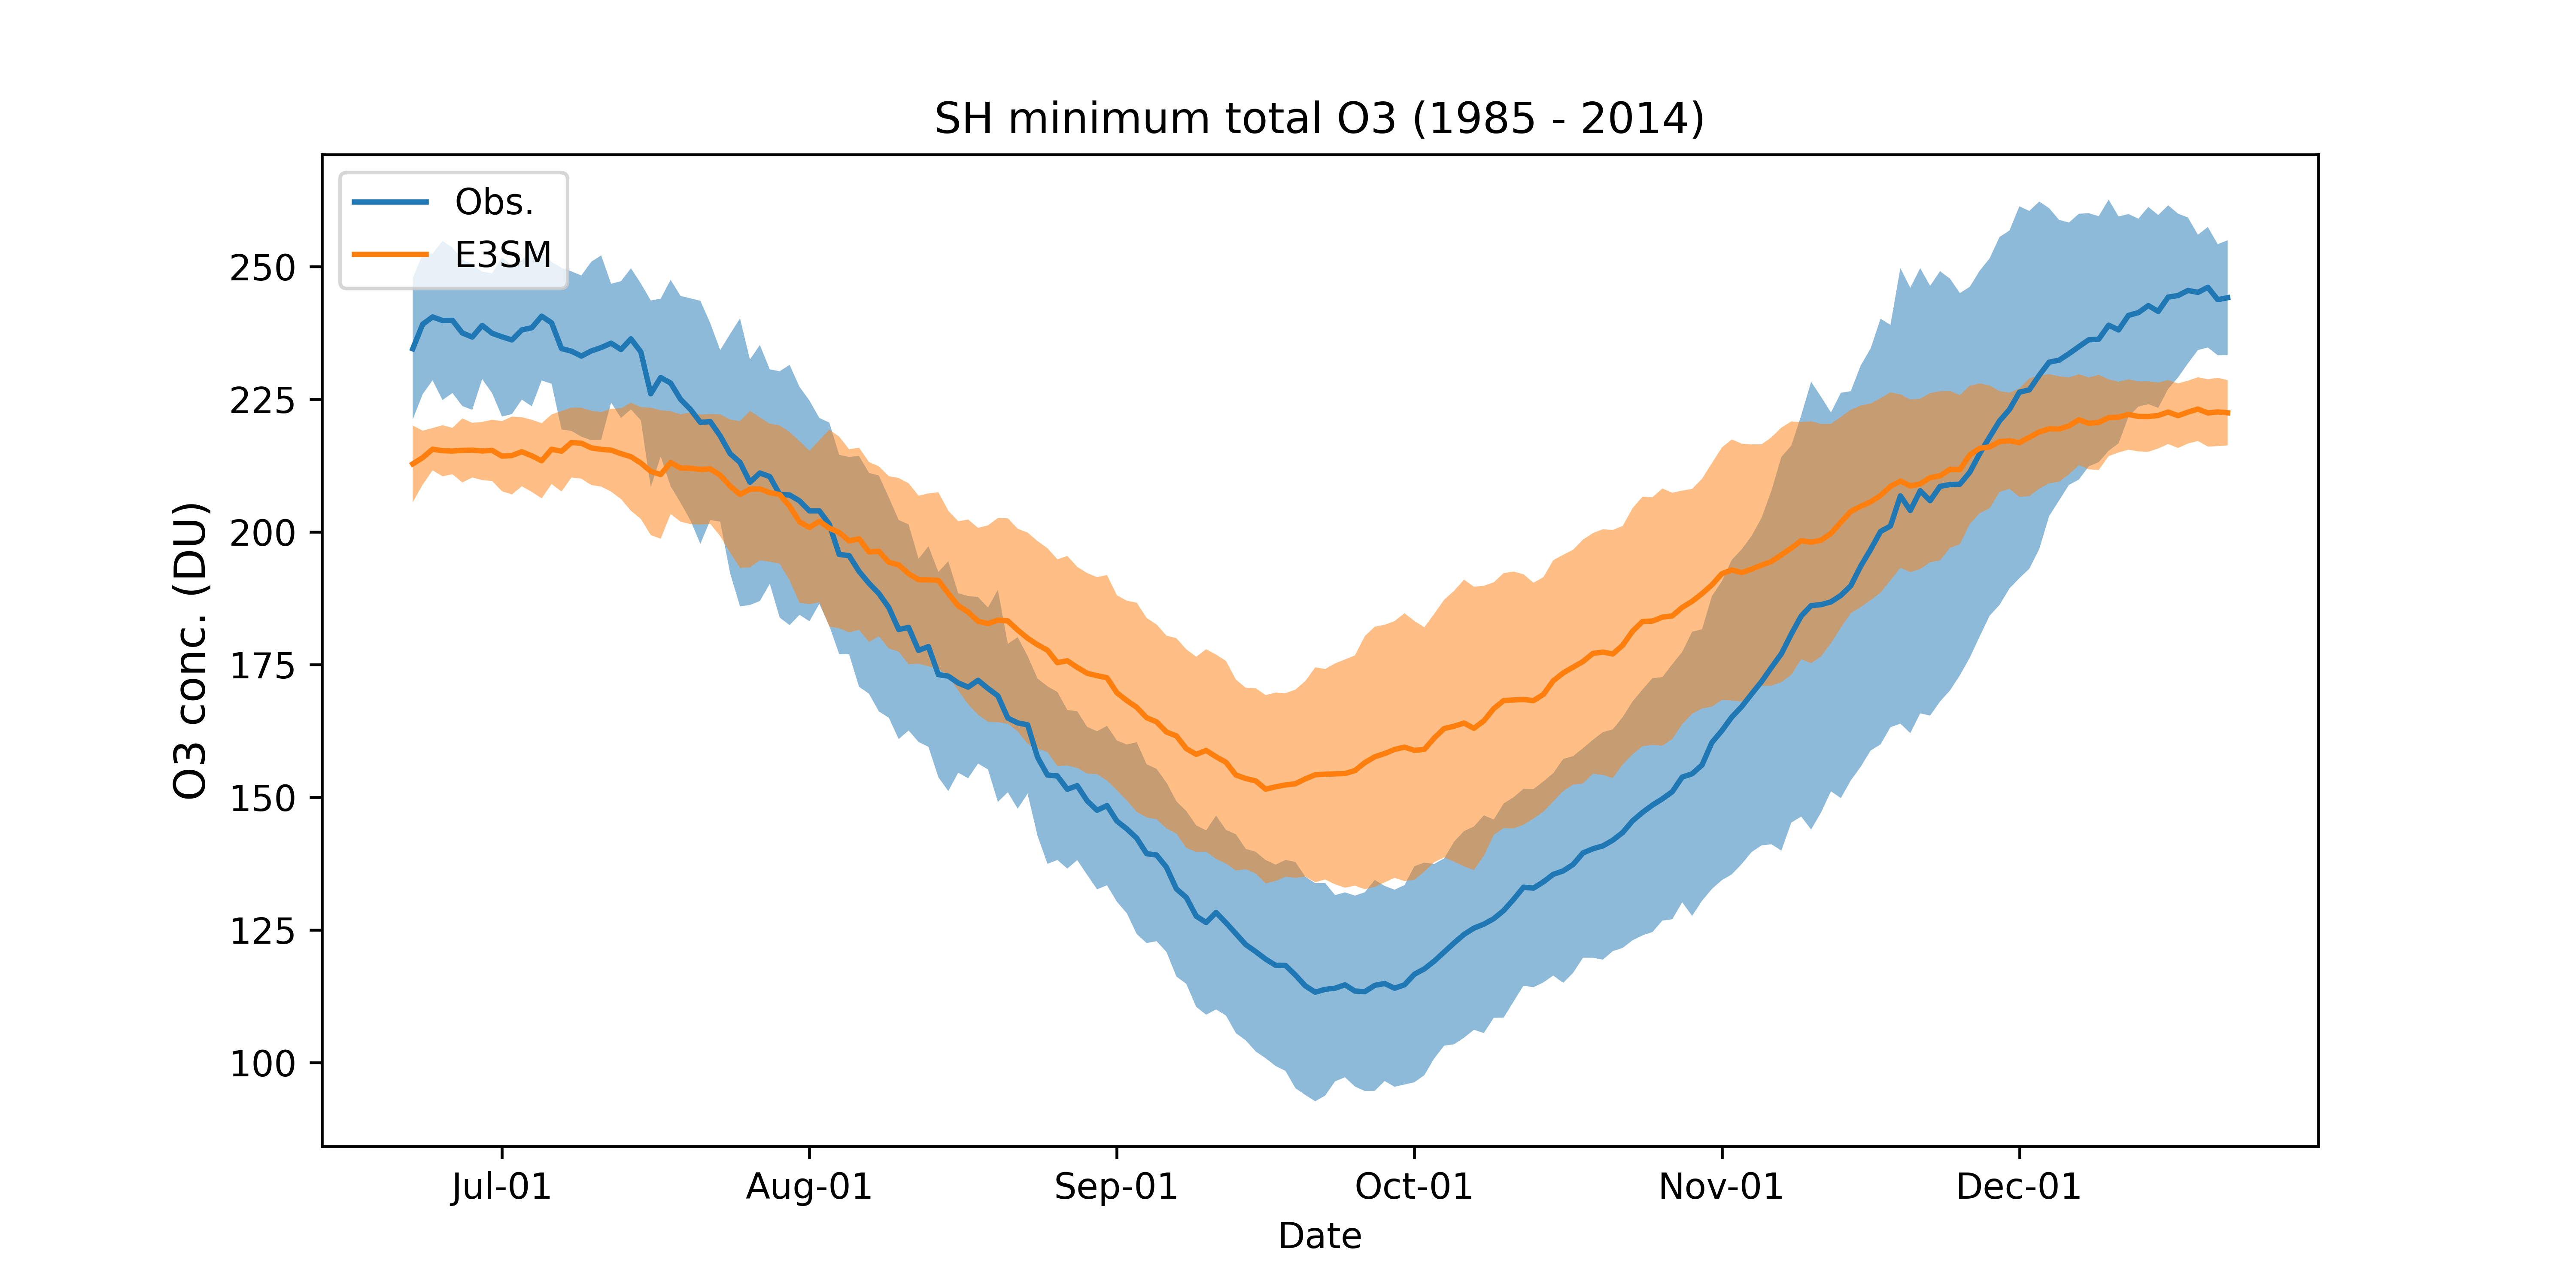
Ozone hole areas mins
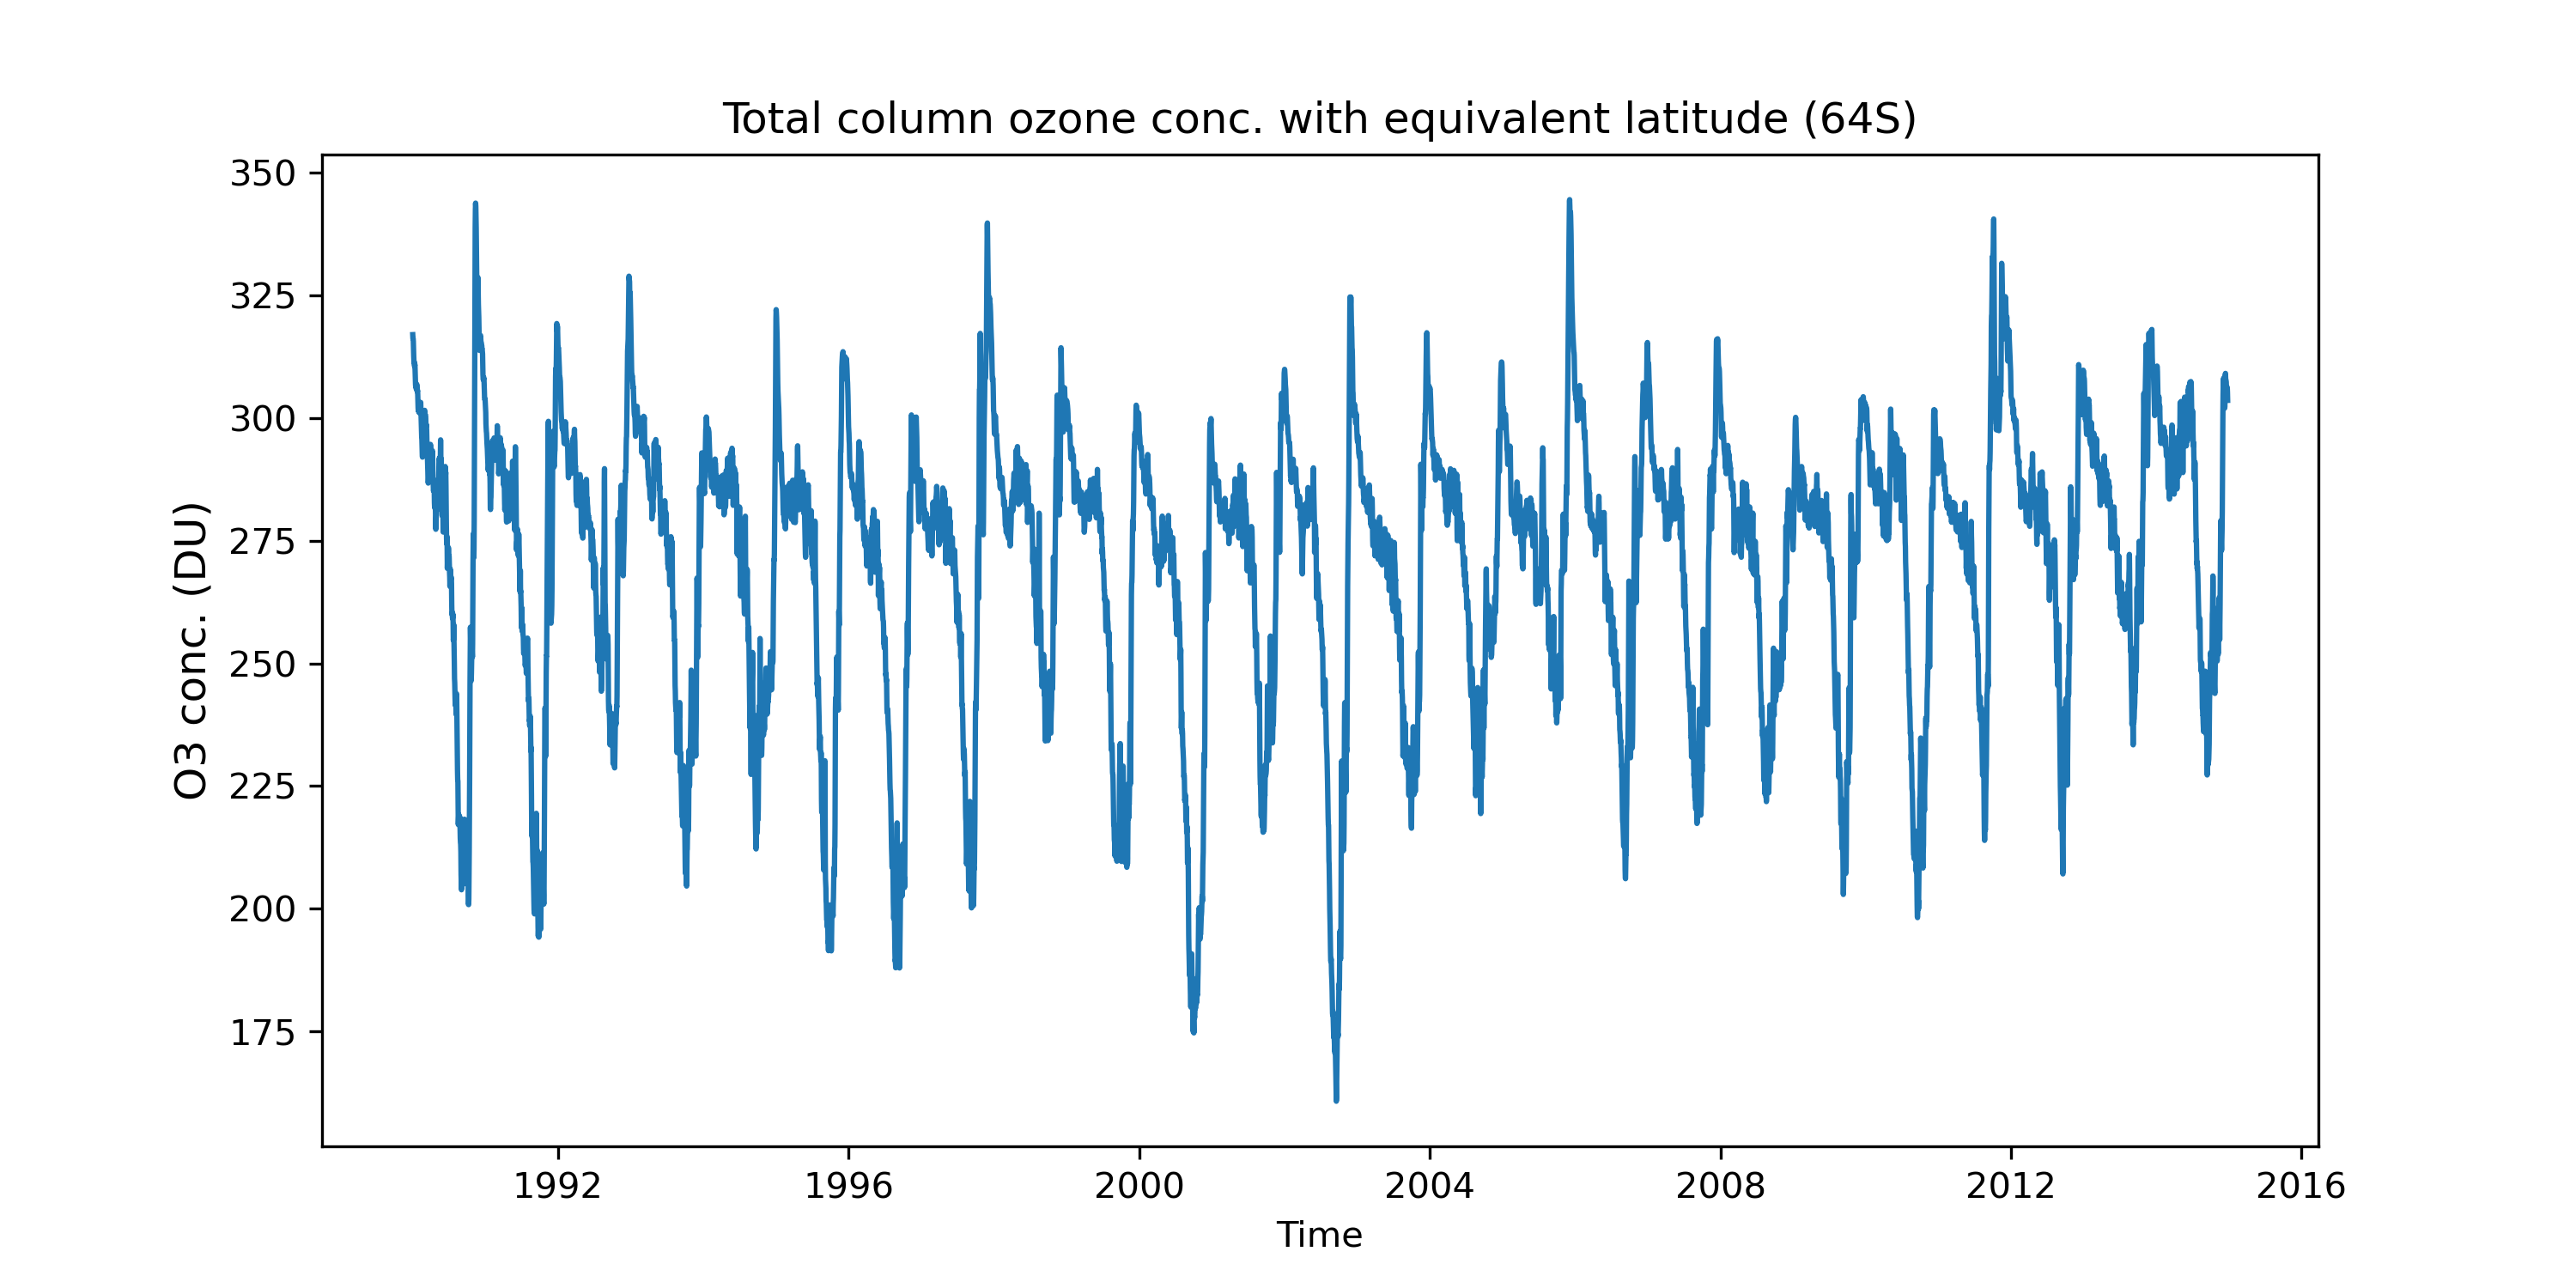
Ozone hole with equivalent latitude time_series climate
Ozone STE flux time series monthly lat-lon plot
QBO diagnostics Lat-time plot for TCO anom vs QBO phase
Total column ozone (TCO) anomaly (DU, relative to 1979-2020 mean) as a function of QBO phase for (left) Multi-Sensor Reanalysis version 2,
(right) E3SMv2 ObsQBO simulation. 0 is centered on the month when QBO transits from QBOE to QBOW.
Pres-time plot for O3 anom vs QBO phase
Pressure-time plot of the anomalous ozone concentration (ppm, relative to 1985-2020 mean) as a function of QBO phase for (left row) CMZM,
(right row) E3SMv2 ObsQBO simulation. 0 is centered on the month when QBO transits from QBOE to QBOW.
Pres-time plot for T/O3 anom vs QBO phase
Pressure-time anomalous (left row) temperature (K), (middle row)  steady state ozone (SSO, ppm), and (right row) WSTAR (m/s) for E3SMv2.
0 is centered on the month when QBO transits from QBOE to QBOW. SSO is derived using a linearized ozone chemistry model (Linoz). WSTAR is
the transformed Eulerian mean variable for vertical transport.
Temperature with equivalent latitude plot
Chemistry tendency table ANN(txt) DJF(txt) MAM(txt) JJA(txt) SON(txt)
closure check and burden(txt)
Chemistry production/loss tendency table ANN DJF MAM JJA SON
Chem high-level summary table table